 线性算法
线性算法
# KNN与线性算法对比
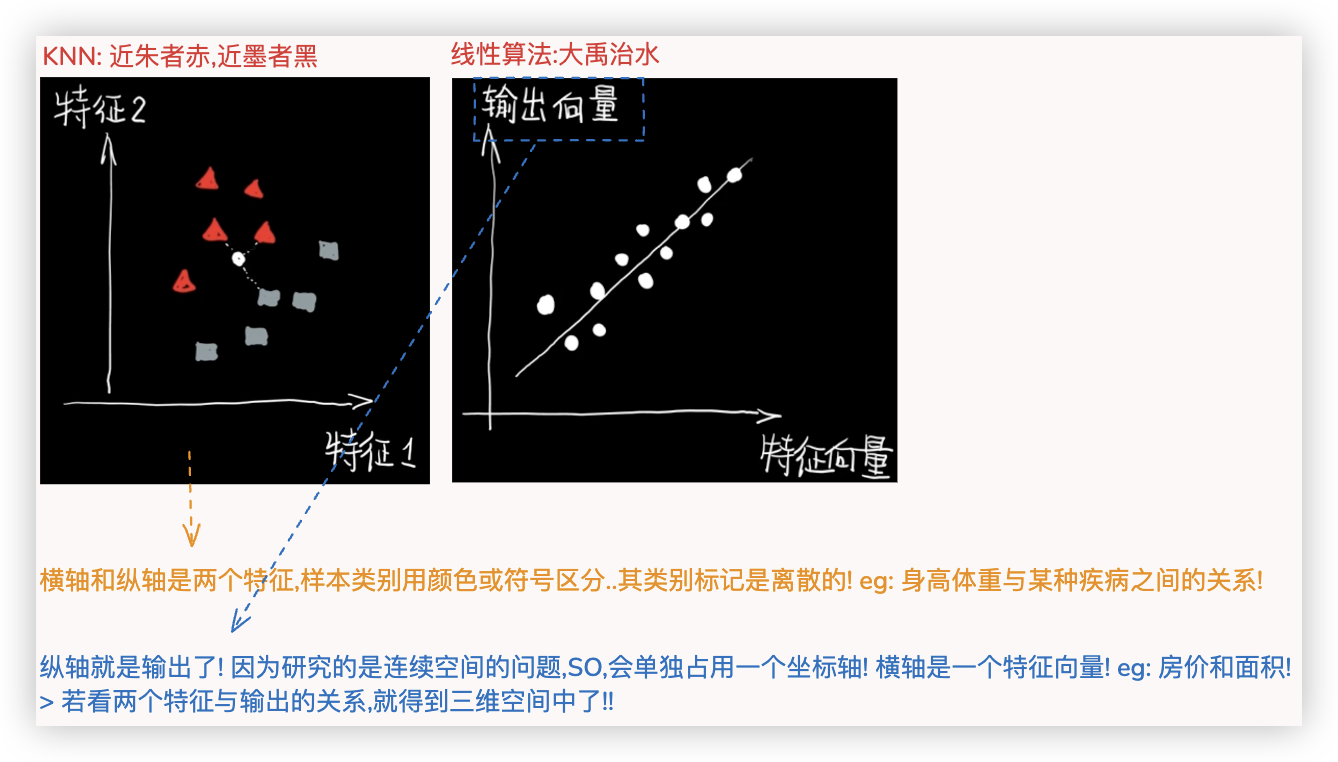
KNN和线性算法都可用于分类任务和回归任务.
★ 但KNN更关注空间位置关系 So,KNN更擅长分类; 线性算法更强调时间或逻辑上的先后关系, So, 线性算法更擅长回归!
# 核心思想和原理
- ★ 关于民主投票的策略
- KNN - 是点到点的距离 - 找K个近邻点 - 线性,类别; 回归,均值
- 一元、多元、多项式 - 都可化简为找到二维坐标中的一条最优线(直线、曲线), 是点到线的距离
- 逻辑回归 (处理二分类问题) - 也是找最优线, 本质上也是距离, 该距离是实际值和真实值之间的差异, 是一个概率值!
- ★ 线性算法对应方程的最优解
- 距离就是误差
- 一元、多元、多项式的方程都能写出来, 将其通过数学方法"线性代数、变量替换" 化简 映射到二维坐标系中后
代入 评判标准/损失函数中, 再通过数学方法"最小二乘法" 可得到最优解.. 它们的最优解是方程.. - 逻辑回归的方程的含义是概率, 其对应的 评判标准/损失函数 是一个log函数.. 其最优解只能通过梯度下降求得..
# 一元线性回归
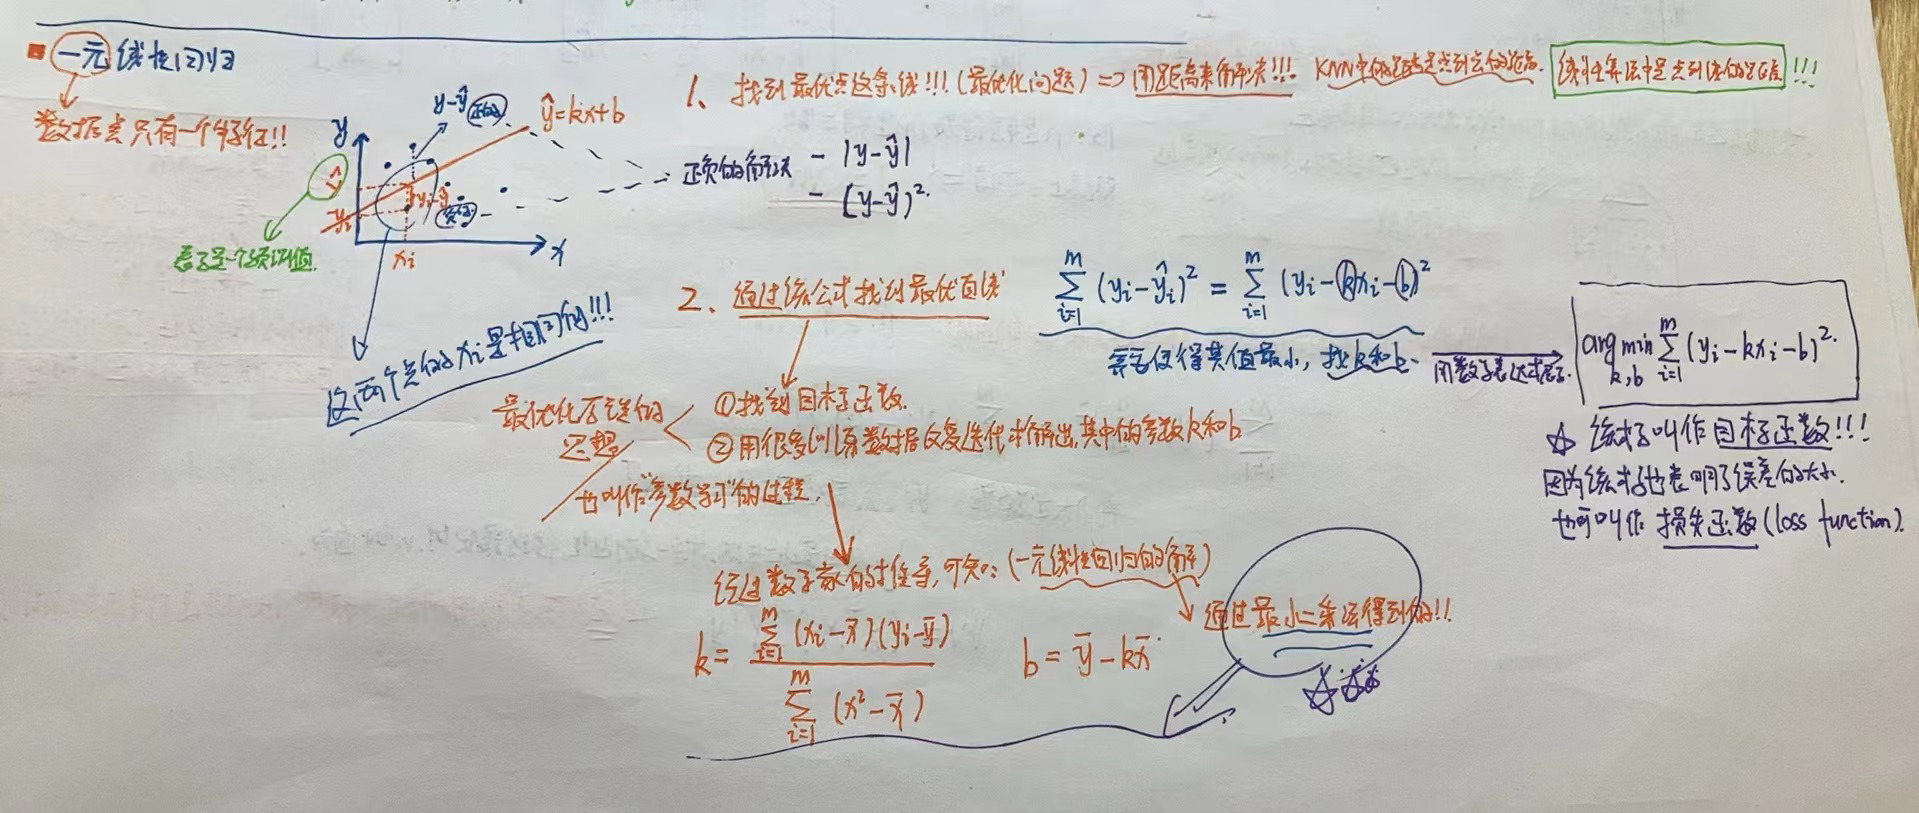
一元线性回归 找到一条线 其方程是
何为最优? 评判标准是
数学家们通过 最小二乘法, 求得了一元回归方程的最优解/目标函数的最小值.. 其k和b都可用公式来表示!!
$ k = \frac{\sum_{i=1}^{m} (x_i - \bar{x})(y_i - \bar{y})}{\sum_{i=1}^{m} (x_i^2 - \bar{x})} $
# 多元线性回归
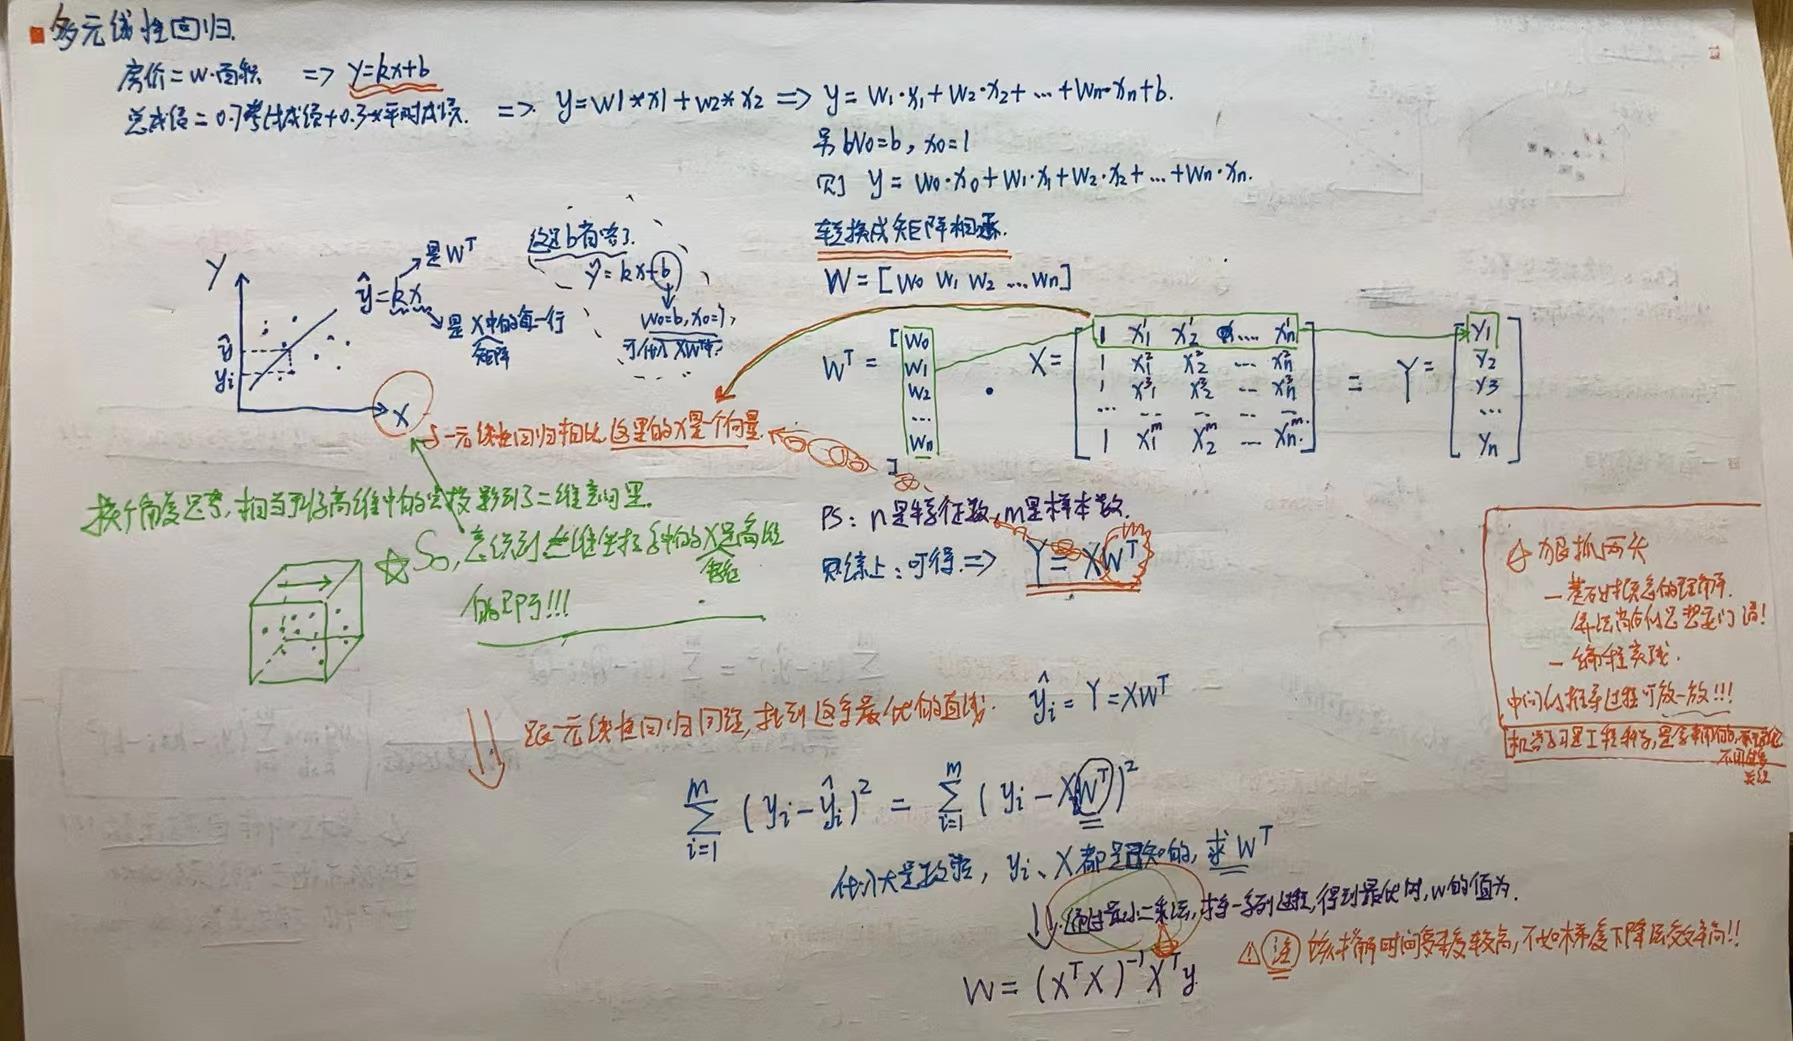
假如有两维特征,那么就得在 三维坐标里展示,从正方形的上面往下看,可将空间中的这些数据点映射到一个二维坐标中..
该过程是通过线性代数实现的..通过数学转化,多元线性回归 找到的那条线的方程 就是
注意,在该二维坐标中横坐标x的含义 - 一元线性回归里是一个值,多元回归里就变成了一个向量啦. eg:
同理,需找的映射的这个二维坐标中,最优的那条线..
将方程
# 多项式回归

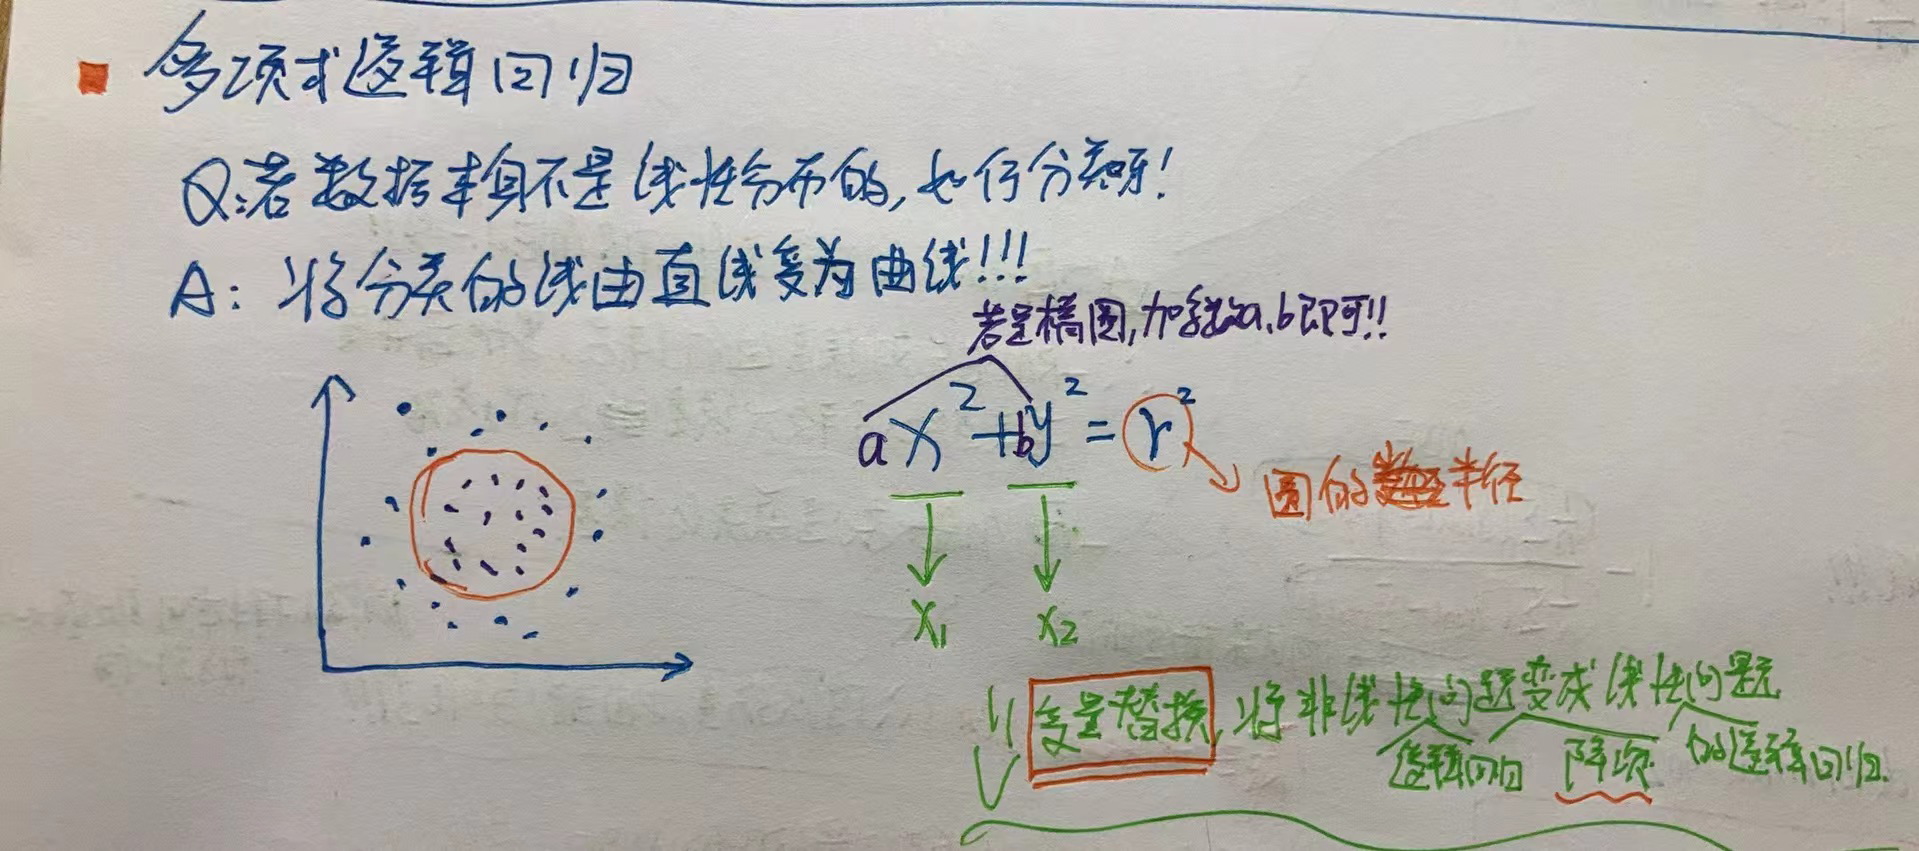
多项式回归, 通过变量替换, 其方程的样子就变成了 多元线性回归的方程..
★ 多项式回归的本质是为原来的样本添加一些特征, 即升维, 而这些特征是原来特征的多项式项. eg: x1是x^2..
通过添加特征后,就可用线性回归的思路来进行拟合!!
# 逻辑回归
- 逻辑回归干的是二分类的活, 为何会跟一元、多元、多项式放在一起理解? 你这样理解:
所谓的分类, 即这些数据点多大概率上是属于同一类别.. 概率意味着是连续的值, 因而 分类问题也就转化成了回归问题.. - 逻辑回归本质上也是找线, 但关注点 不是让这条线去拟合这些数据点/不是让数据多尽量在这条线上.
而是让这些数据点尽量的在这条线的两边..
◎ 先来看看逻辑回归的方程
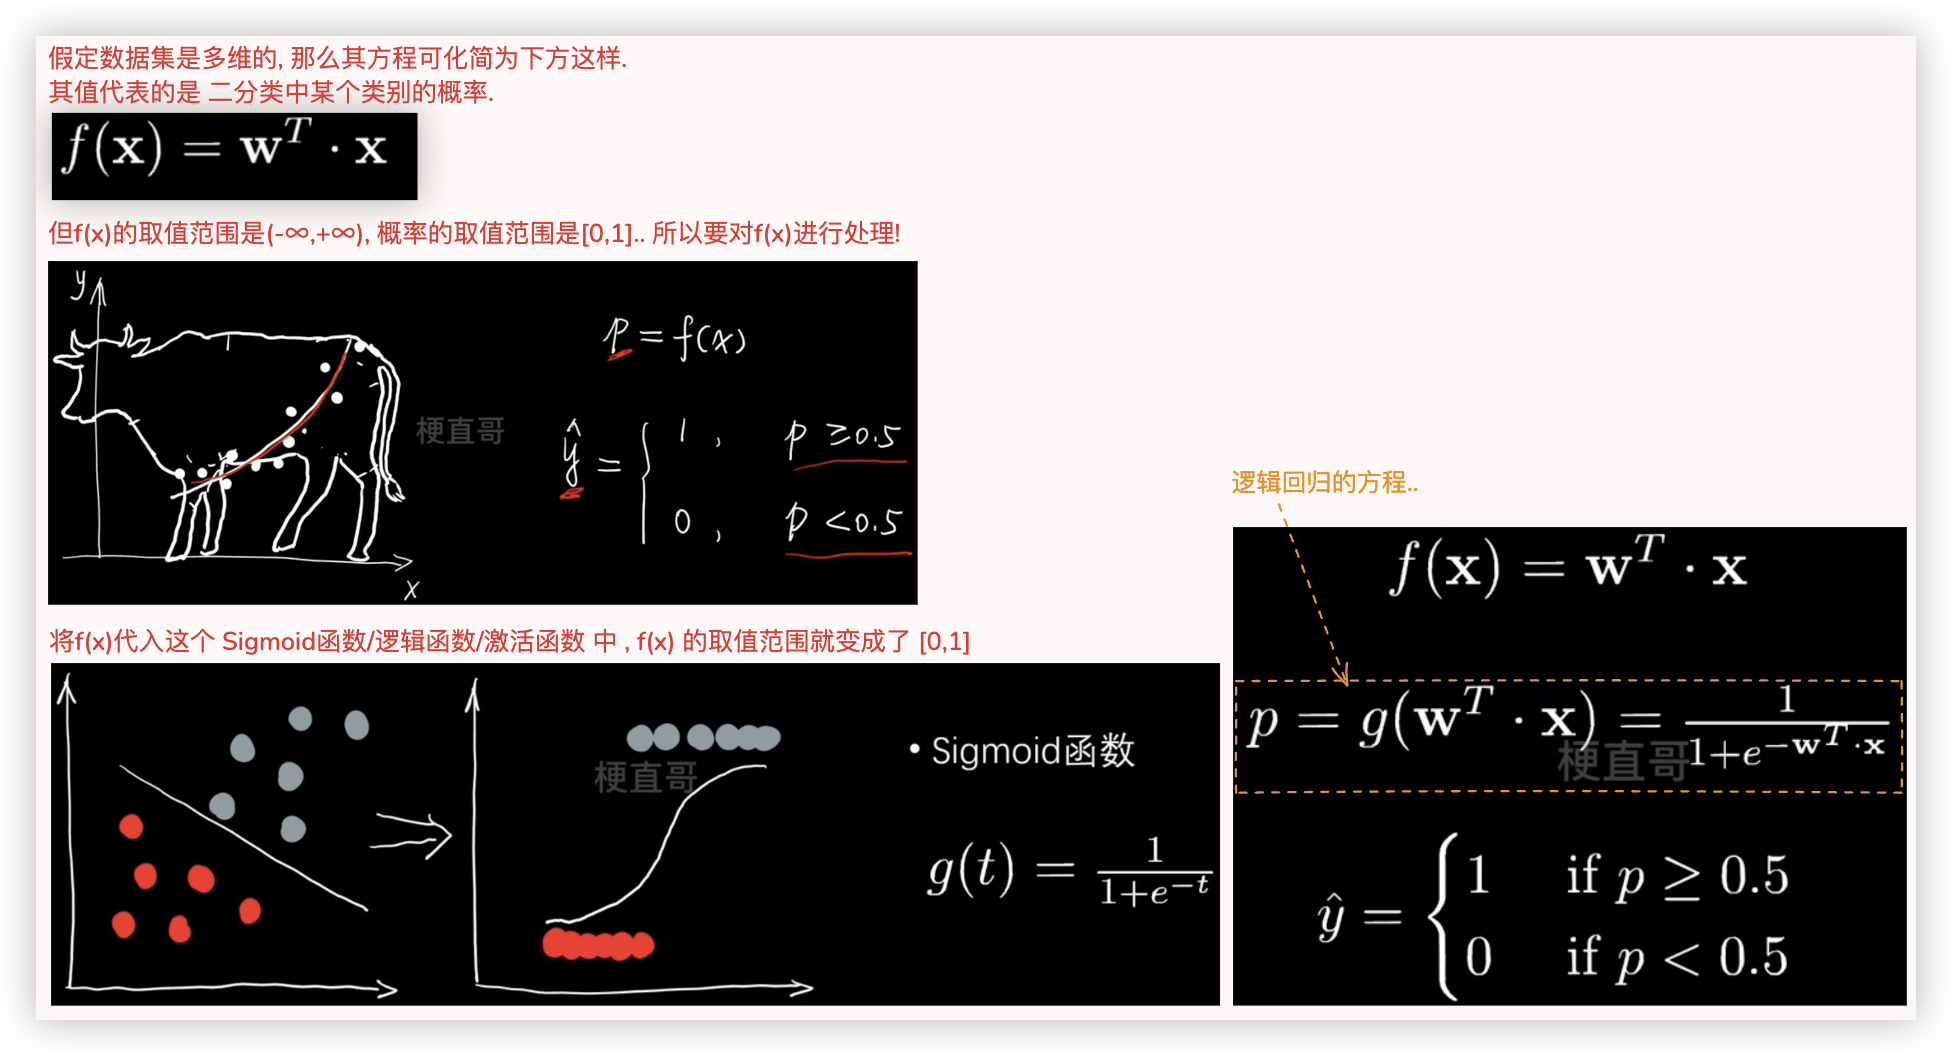
◎ 再来看看逻辑回归的 目标函数/损失函数

求解该目标函数/损失函数的w,不能像前面一样得到一个公式了, 需要用到梯度下降法逐步优化来找的最优解..
# 多项式逻辑回归
# 一元和多元算法实现
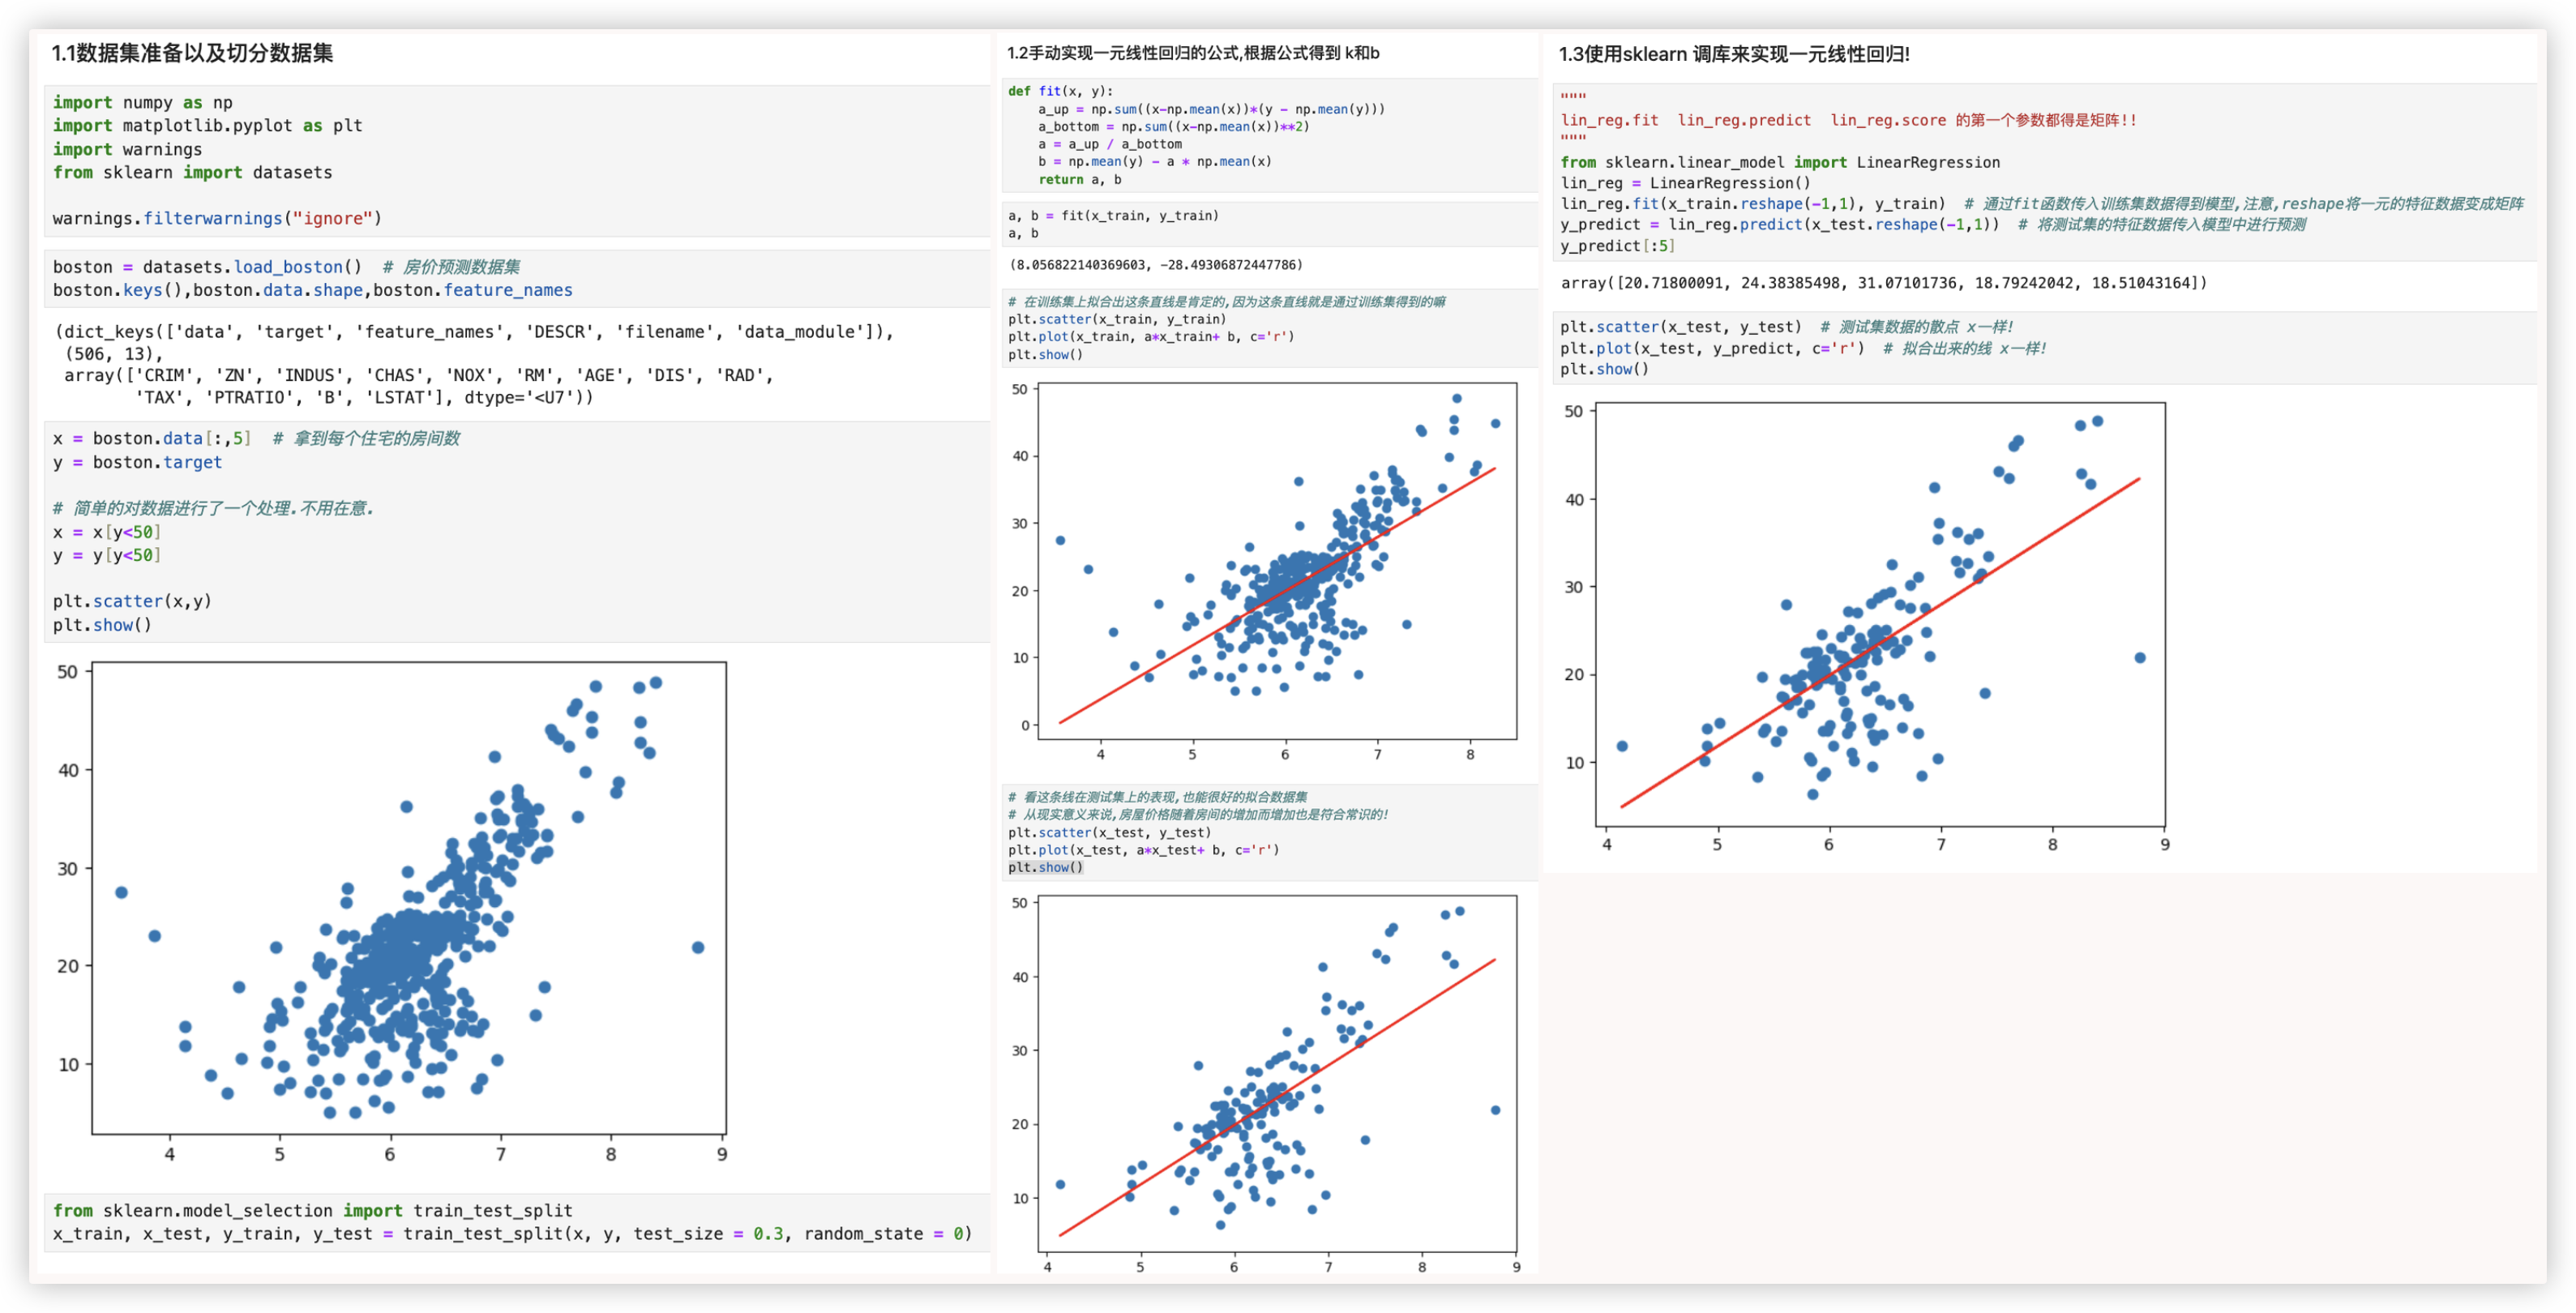
# 一元线性回归代码
"""
数据集准备以及切分数据集
"""
import numpy as np
import matplotlib.pyplot as plt
import warnings
from sklearn import datasets

warnings.filterwarnings("ignore")

boston = datasets.load_boston()  # 房价预测数据集
boston.keys(),boston.data.shape,boston.feature_names

x = boston.data[:,5]  # 拿到每个住宅的房间数
y = boston.target

# 简单的对数据进行了一个处理.不用在意.
x = x[y<50]
y = y[y<50]

plt.scatter(x,y)
plt.show()

from sklearn.model_selection import train_test_split
x_train, x_test, y_train, y_test = train_test_split(x, y, test_size = 0.3, random_state = 0)


"""
手动实现一元线性回归的公式,根据公式得到 k和b
"""
def fit(x, y):
    a_up = np.sum((x-np.mean(x))*(y - np.mean(y)))
    a_bottom = np.sum((x-np.mean(x))**2)
    a = a_up / a_bottom
    b = np.mean(y) - a * np.mean(x)
    return a, b

a, b = fit(x_train, y_train)
a, b

# 在训练集上拟合出这条直线是肯定的,因为这条直线就是通过训练集得到的嘛
plt.scatter(x_train, y_train)
plt.plot(x_train, a*x_train+ b, c='r')
plt.show()

# 看这条线在测试集上的表现,也能很好的拟合数据集
# 从现实意义来说,房屋价格随着房间的增加而增加也是符合常识的!
plt.scatter(x_test, y_test)
plt.plot(x_test, a*x_test+ b, c='r')
plt.show()

"""
使用sklearn 调库来实现一元线性回归!
"""
"""lin_reg.fit  lin_reg.predict  lin_reg.score 的第一个参数都得是矩阵!!"""
from sklearn.linear_model import LinearRegression
lin_reg = LinearRegression()
lin_reg.fit(x_train.reshape(-1,1), y_train)  # 通过fit函数传入训练集数据得到模型,注意,reshape将一元的特征数据变成矩阵
y_predict = lin_reg.predict(x_test.reshape(-1,1))  # 将测试集的特征数据传入模型中进行预测
y_predict[:5]

plt.scatter(x_test, y_test)  # 测试集数据的散点 x一样!
plt.plot(x_test, y_predict, c='r')  # 拟合出来的线 x一样!
plt.show()
2
3
4
5
6
7
8
9
10
11
12
13
14
15
16
17
18
19
20
21
22
23
24
25
26
27
28
29
30
31
32
33
34
35
36
37
38
39
40
41
42
43
44
45
46
47
48
49
50
51
52
53
54
55
56
57
58
59
60
61
62
63
64
# 多元线性回归代码
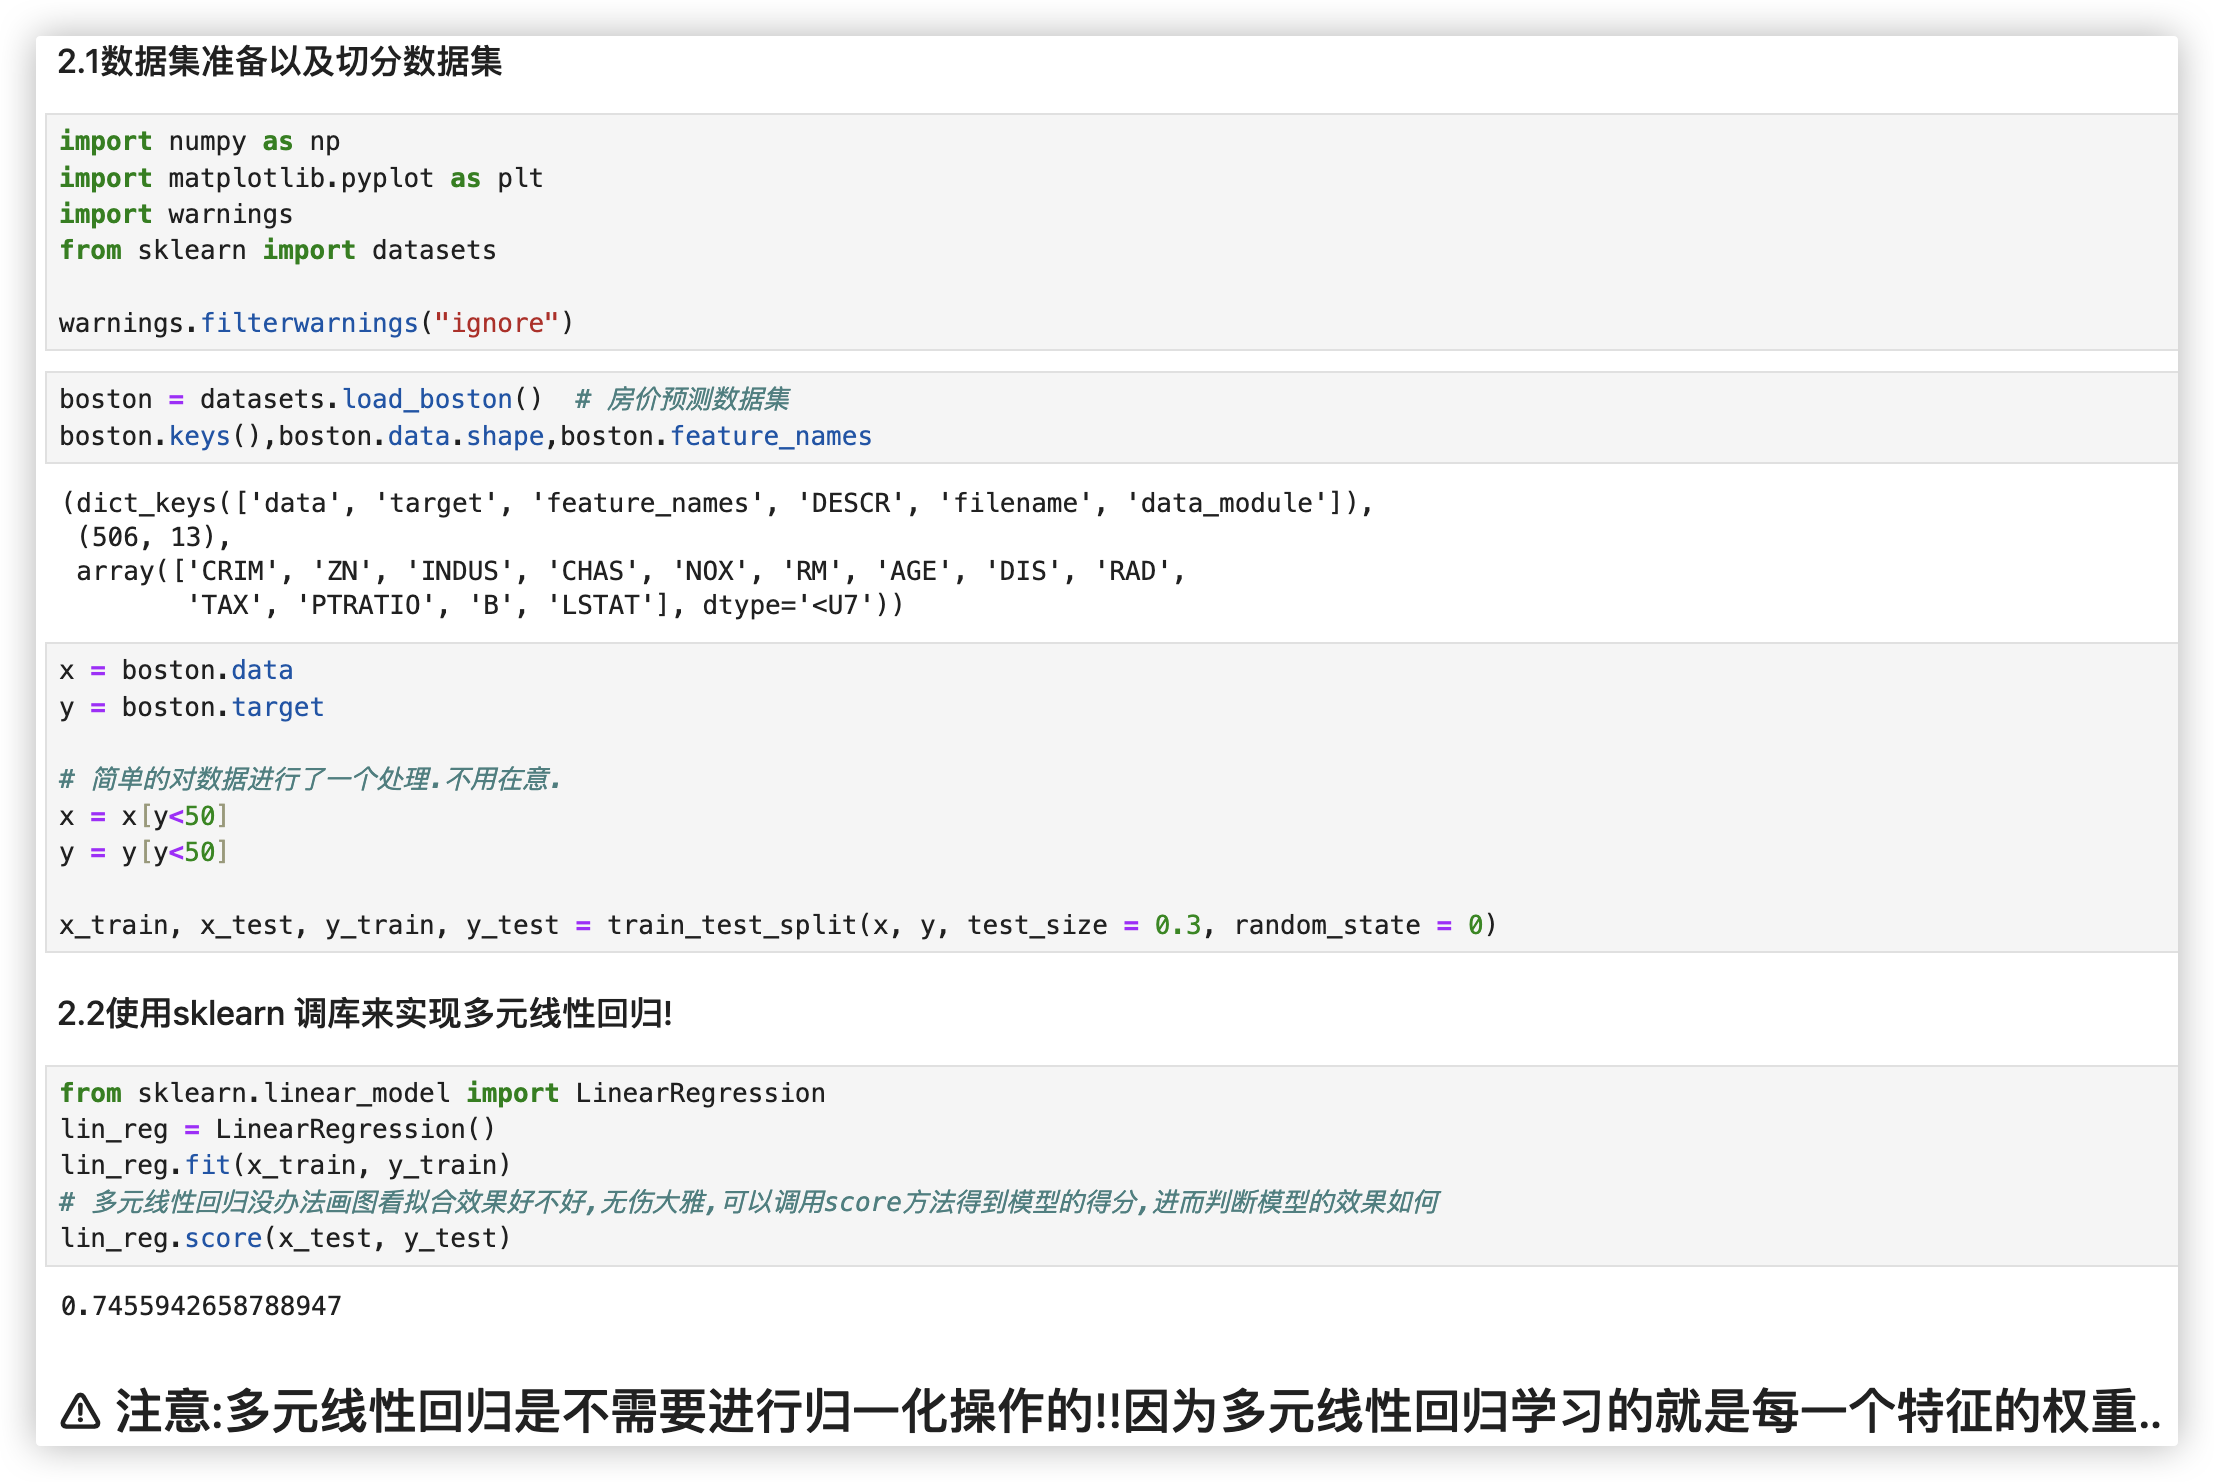
★ 注意:多元线性回归是不需要进行归一化操作的!!因为多元线性回归学习的就是每一个特征的权重..
"""
数据集准备以及切分数据集
"""
import numpy as np
import matplotlib.pyplot as plt
import warnings
from sklearn import datasets

warnings.filterwarnings("ignore")

boston = datasets.load_boston()  # 房价预测数据集
boston.keys(),boston.data.shape,boston.feature_names

x = boston.data
y = boston.target

# 简单的对数据进行了一个处理.不用在意.
x = x[y<50]
y = y[y<50]

x_train, x_test, y_train, y_test = train_test_split(x, y, test_size = 0.3, random_state = 0)

"""
使用sklearn 调库来实现多元线性回归!
"""
from sklearn.linear_model import LinearRegression
lin_reg = LinearRegression()
lin_reg.fit(x_train, y_train)
# 多元线性回归没办法画图看拟合效果好不好,无伤大雅,可以调用score方法得到模型的得分,进而判断模型的效果如何
lin_reg.score(x_test, y_test)
2
3
4
5
6
7
8
9
10
11
12
13
14
15
16
17
18
19
20
21
22
23
24
25
26
27
28
29
30
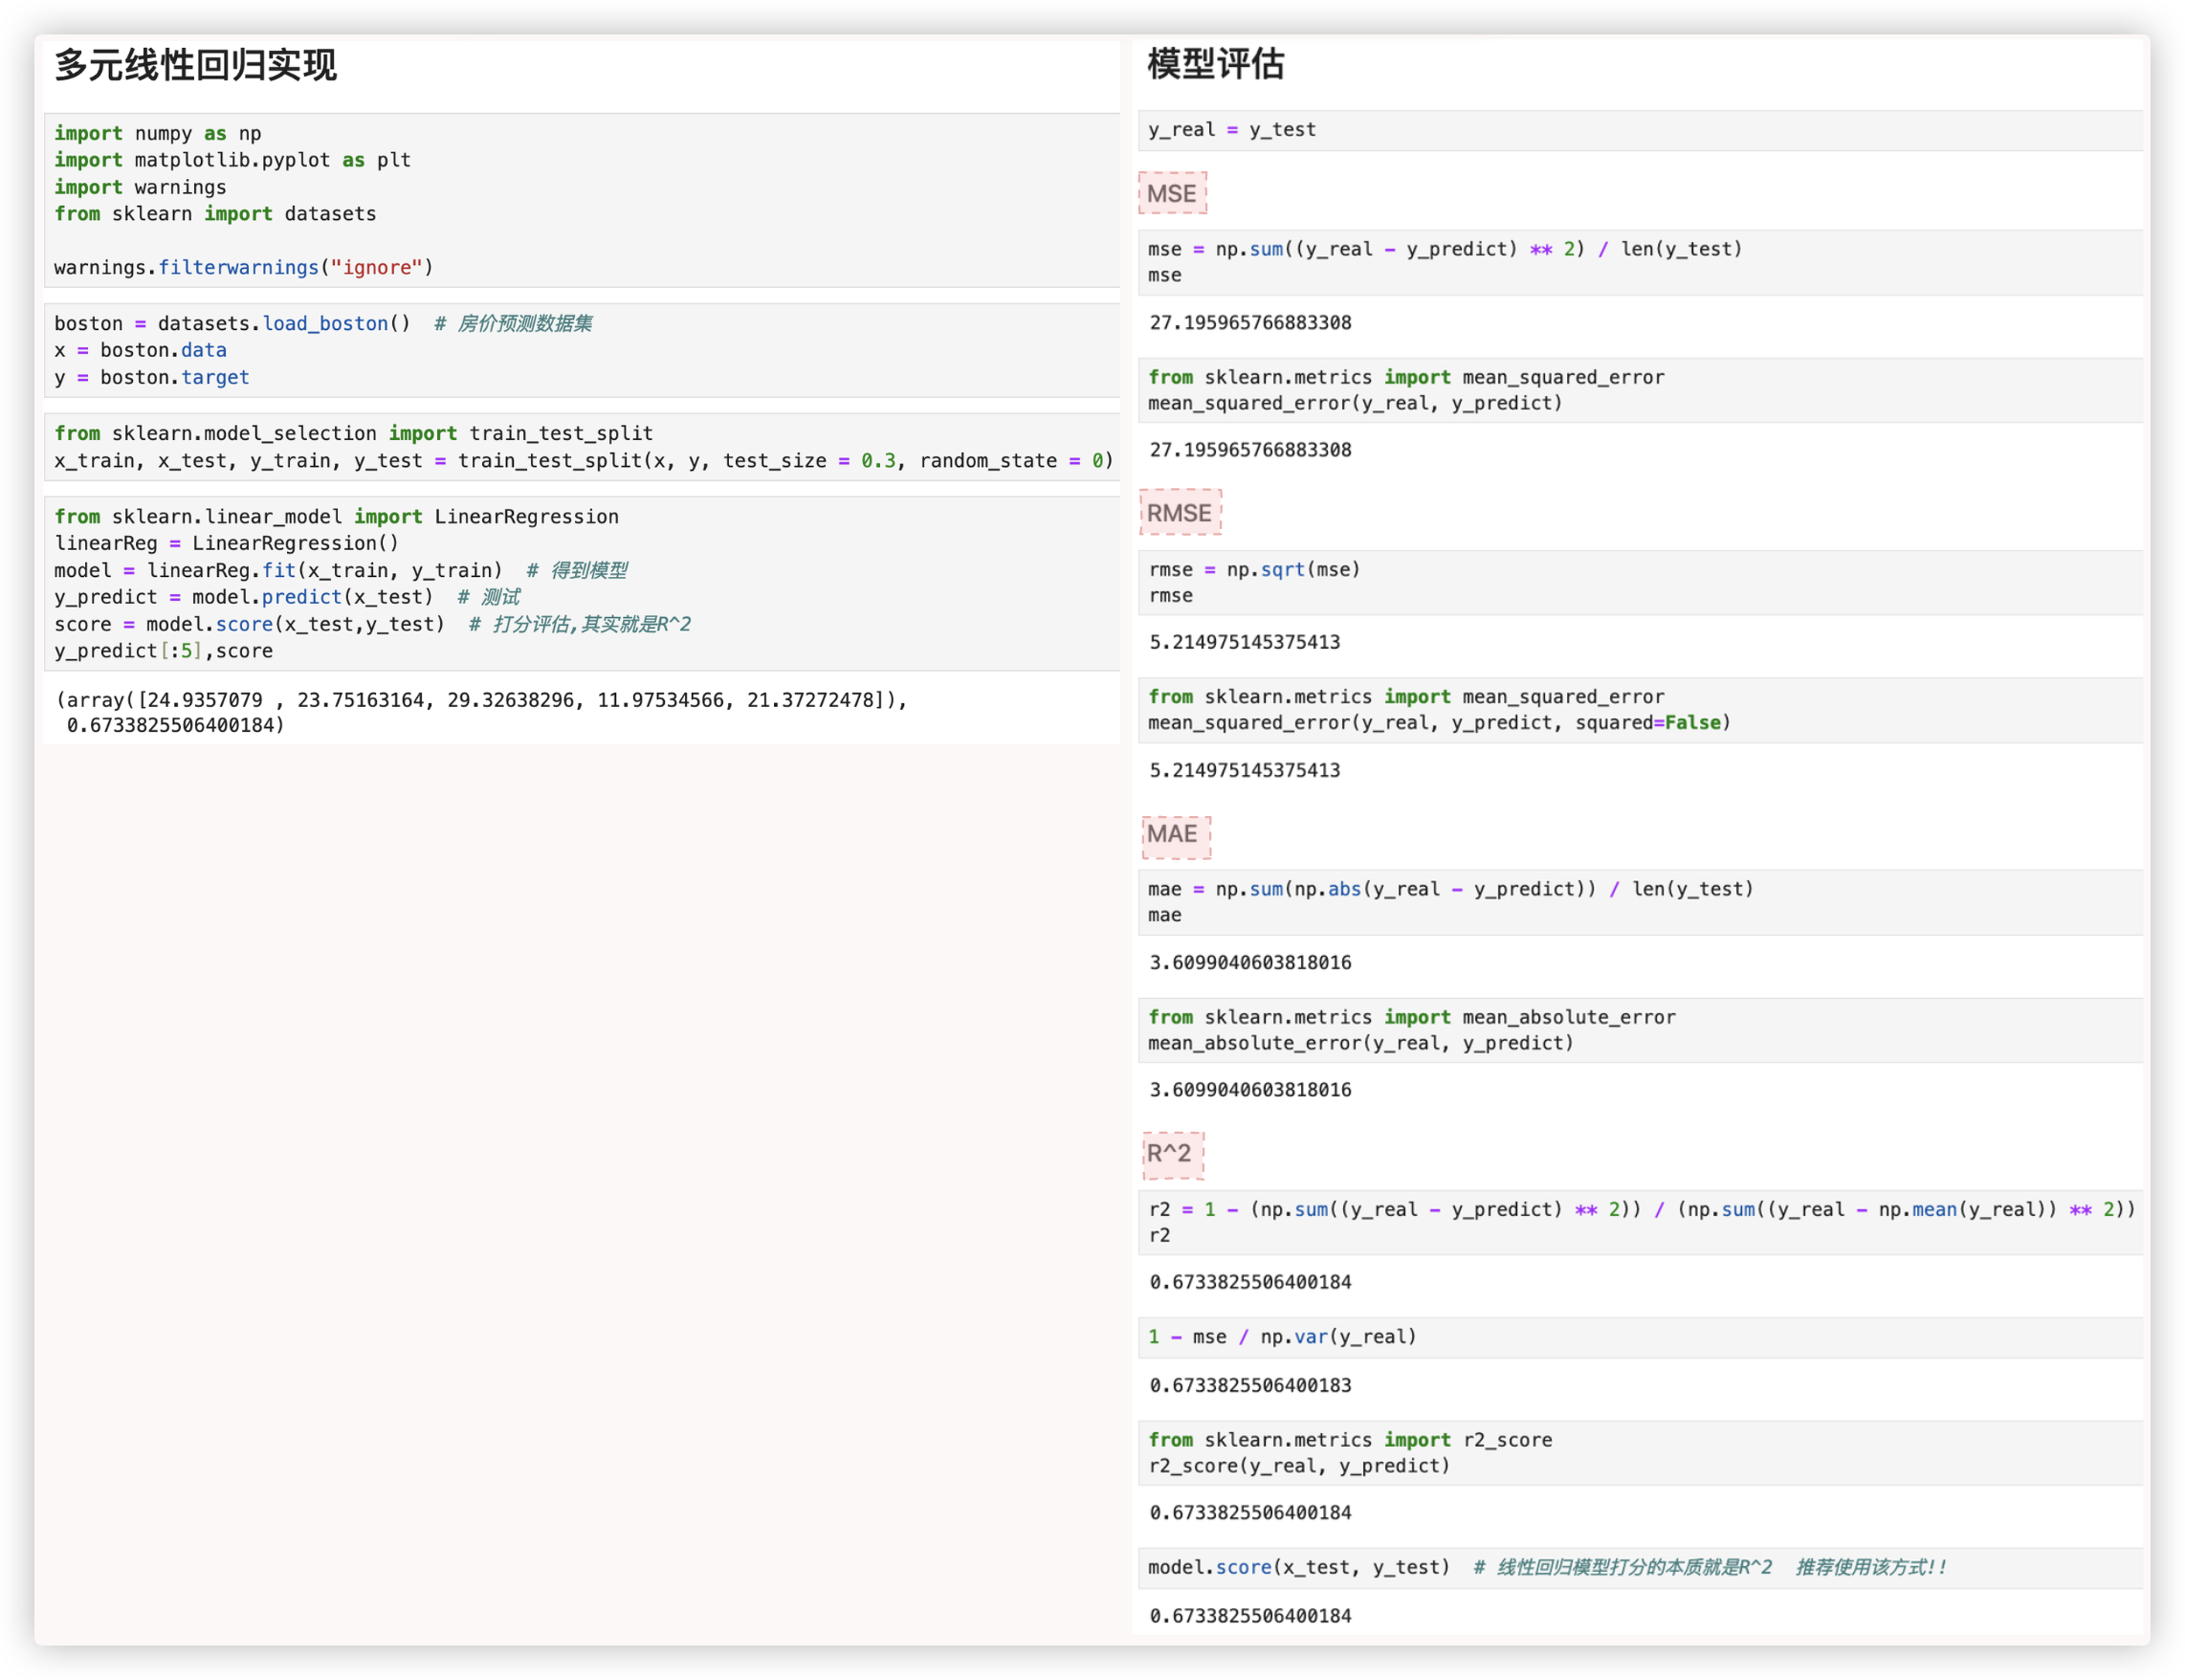
# MSE、RMAE、MAE、R^2
"""
模型评估
"""
y_real = y_test

"""MSE"""
mse = np.sum((y_real - y_predict) ** 2) / len(y_test)
mse

from sklearn.metrics import mean_squared_error
mean_squared_error(y_real, y_predict)


"""RMSE"""
rmse = np.sqrt(mse)
rmse

from sklearn.metrics import mean_squared_error
mean_squared_error(y_real, y_predict, squared=False)


"""MAE"""
mae = np.sum(np.abs(y_real - y_predict)) / len(y_test)
mae

from sklearn.metrics import mean_absolute_error
mean_absolute_error(y_real, y_predict)


"""R^2"""
r2 = 1 - (np.sum((y_real - y_predict) ** 2)) / (np.sum((y_real - np.mean(y_real)) ** 2))
r2

1 - mse / np.var(y_real)

from sklearn.metrics import r2_score
r2_score(y_real, y_predict)

model.score(x_test, y_test)
2
3
4
5
6
7
8
9
10
11
12
13
14
15
16
17
18
19
20
21
22
23
24
25
26
27
28
29
30
31
32
33
34
35
36
37
38
39
# 多项式回归代码实现
