 商场销售数据分析
慢慢来,别急,熟能生巧!
△ 先申明俺使用的版本 - numpy==1.26.4 ; pandas == 1.4.4, 为了保证你与我的运行结果统一, 请务必保证版本的一致!!
# ※ 项目的完整代码
测试数据提取链接: https://pan.baidu.com/s/1Ux448PKeNuD4pItQ-FS0jw?pwd=ph5y 提取码: ph5y
import matplotlib.pyplot as plt
import numpy as np
import pandas as pd

plt.rcParams['font.sans-serif'] = ['PingFang HK']
plt.rcParams['axes.unicode_minus'] = False
plt.figure(figsize=(12, 8))

# ■ 第一部分: 数据类型处理
df = pd.read_csv(
    './CDNOW_master.txt', header=None, sep=r"\s+",
    names=['user_id', 'order_dt', 'order_product', 'order_amount'])

df['order_dt'] = pd.to_datetime(df['order_dt'], format="%Y%m%d")
df['month'] = df['order_dt'].astype('datetime64[M]')

# ■ 第二部分: 按月进行分析
# Q1:每个月的销售金额并画图
amount_sum_series = df.groupby('month')['order_amount'].sum()
amount_sum_series.plot()
plt.show()

# Q2:每个月的产品购买量 (与Q1同理)
product_sum_series = df.groupby('month')['order_product'].sum()

# Q3:每个月的消费次数
series_1 = df.groupby('month').size()
series_2 = df.groupby('month')['user_id'].count()

# Q4:每个月的消费人数
series_3 = df.groupby('month')['user_id'].nunique()

# ■ 第三部分: 用户个体消费数据分析
# Q1: 各个用户消费金额和消费产品数量的散点图
user_amount_series = df.groupby('user_id')['order_amount'].sum()
user_product_series = df.groupby('user_id')['order_product'].sum()
plt.scatter(user_amount_series, user_product_series)
plt.xlabel("用户个体消费的总金额")
plt.ylabel("用户个体购买的产品总数量")
plt.show()

# Q2: 各个用户消费总金额(金额数<=1000)的直方分布图
user_amount_series = df.groupby('user_id')['order_amount'].sum()
user_amount_series = user_amount_series[user_amount_series <= 1000]
plt.hist(user_amount_series, bins=20)
plt.show()

# Q3: 各个用户购买产品总数(购买数量<=100)的直方分布图
user_product_series = df.groupby('user_id')['order_product'].sum()
user_product_series = user_product_series[user_product_series <= 100]
plt.hist(user_product_series, bins=20)
plt.show()

# ■ 第四部分: 用户消费行为分析
# Q1:每月的新增用户数
temp = df.groupby('user_id')['month'].min().value_counts().sort_index()
my_s = pd.Series(index=sorted(df['month'].unique()), data=temp.to_dict())
my_s = my_s.fillna(0)
my_s.plot()
plt.show()

# Q2:每月的流失用户数
temp = df.groupby('user_id')['month'].max().value_counts().sort_index()
temp.plot()
plt.show()

# Q3:新老用户占比
df_new_old = df.groupby(by='user_id')['order_dt'].agg(['min', 'max'])  # 对每个分组里的同一列进行多种聚合
new_old_counts_series = (df_new_old['min'] == df_new_old['max']).value_counts()
plt.pie(x=new_old_counts_series, autopct='%.1f%%', labels=["新客户", "老客户"], explode=[0, 0.1])
plt.show()

# Q4: 每个用户的总购买量和总消费金额和最近一次消费的时间的表格
temp = df.groupby(by='user_id').agg({'order_product': 'sum', 'order_amount': 'sum', 'order_dt': 'max'})  # 对每个分组里的不同列进行任意的聚合
temp['R'] = (df["order_dt"].max() - temp["order_dt"]) / np.timedelta64(1, 'D')
rfm = temp[["R", "order_product", "order_amount"]]
# rfm = rfm.rename(columns={"order_product": "F", "order_amount": "M"}) 这样改列索引也可以.
rfm.columns = ['R', 'F', 'M']


# rfm分层算法
def rfm_func(x):
    level = x.map(lambda i: '1' if i > 0 else '0')
    label = level.sum()  # eg:"011"
    d = {
        '111': '重要价值客户',
        '011': '重要保持客户',
        '001': '重要挽留客户',
        '101': '重要发展客户',
        '110': '一般价值客户',
        '100': '一般发展客户',
        '010': '一般保持客户',
        '000': '一般挽留客户'
    }
    return d[label]


temp = rfm.apply(lambda x: x - x.mean(), axis=0)
rfm['label'] = temp.apply(rfm_func, axis=1)
rfm_pic = rfm['label'].value_counts()
# 画饼图
plt.pie(
    x=rfm_pic, autopct='%.1f%%', labels=rfm_pic.index, radius=1.2,
    explode=[0, 0.2, 0, 0.2, 0.2, 0.2, 0, 0])
plt.show()

# ■ 第五部分: 用户的生命周期
# 统计每个用户每个月的消费次数
df_purchase = df.pivot_table(index='user_id', values='order_dt', aggfunc='count', columns='month', fill_value=0)
df_purchase = df_purchase.applymap(lambda x: 1 if x > 0 else 0)


# 固定算法 判断是否为 新、活跃、不活跃、回流用户
def active_status(data):  # data整行数据 共12列 即一个用户的12个月的消费记录
    status = []  # 负责存储用户 12 个月的状态:unreg|new|active|unactive|return
    for i in range(len(data)):
        # 本月没有消费
        if data[i] == 0:
            if len(status) == 0:  # 前面没有任何记录(21年1月份)
                status.append('unreg')
            else:  # 开始判断上一个月状态
                if status[i - 1] == 'unreg':  # 一直未消费过
                    status.append('unreg')
                else:  # 只要本月没有消费当前的为0且不是unreg 只能为unactive
                    status.append('unactive')
        # 本月有消费==1
        else:
            if len(status) == 0:  # 前面没有任何记录(21年1月份)
                status.append('new')
            else:  # 之前有过记录  开始判断上一个月状态
                if status[i - 1] == 'unactive':  # 上个月没有消费
                    status.append('return')
                elif status[i - 1] == 'unreg':  # 以前没有消费过
                    status.append('new')
                else:
                    status.append('active')
    return status


pivoted_status = df_purchase.apply(active_status, axis=1)
df_purchase_new = pd.DataFrame(data=pivoted_status.tolist(), index=df_purchase.index, columns=df_purchase.columns)
# 每月【不同活跃】用户的计数
stats_res = df_purchase_new.apply(lambda x: pd.value_counts(x), axis=0).fillna(0).T

stats_res.plot()
plt.xlabel("月份")
plt.ylabel("用户数")
plt.show()
2
3
4
5
6
7
8
9
10
11
12
13
14
15
16
17
18
19
20
21
22
23
24
25
26
27
28
29
30
31
32
33
34
35
36
37
38
39
40
41
42
43
44
45
46
47
48
49
50
51
52
53
54
55
56
57
58
59
60
61
62
63
64
65
66
67
68
69
70
71
72
73
74
75
76
77
78
79
80
81
82
83
84
85
86
87
88
89
90
91
92
93
94
95
96
97
98
99
100
101
102
103
104
105
106
107
108
109
110
111
112
113
114
115
116
117
118
119
120
121
122
123
124
125
126
127
128
129
130
131
132
133
134
135
136
137
138
139
140
141
142
143
144
145
146
147
148
# 第一部分: 数据类型处理
# 数据加载
import pandas as pd

df = pd.read_csv(
    './CDNOW_master.txt', header=None, sep=r"\s+",
    names=['user_id', 'order_dt', 'order_product', 'order_amount'])

"""
- user_id:  用户ID
- order_dt: 购买日期
- order_product: 购买产品的数量
- order_amount:  购买金额
"""
2
3
4
5
6
7
8
9
10
11
12
注意点:
-1- 不要将第一行数据当列索引. > header=None
-2- csv读取数据时,边读取边指定列索引名称. > name=['','','']
-3- 读取出来只有一列?! txt文件中数据与数据之间的空格个数不一致. > sep=r'\s+'
# 观察数据
★ 就该项目而言, 5步走:
-step1- 查看数据的数据类型.
-step2- 查看数据中是否存在缺失值.
-step3- 将order_dt转换成时间类型.
-step4- 查看数据的统计描述.
-step5- 在源数据中添加一列表示月份: astype('datetime64[M]')
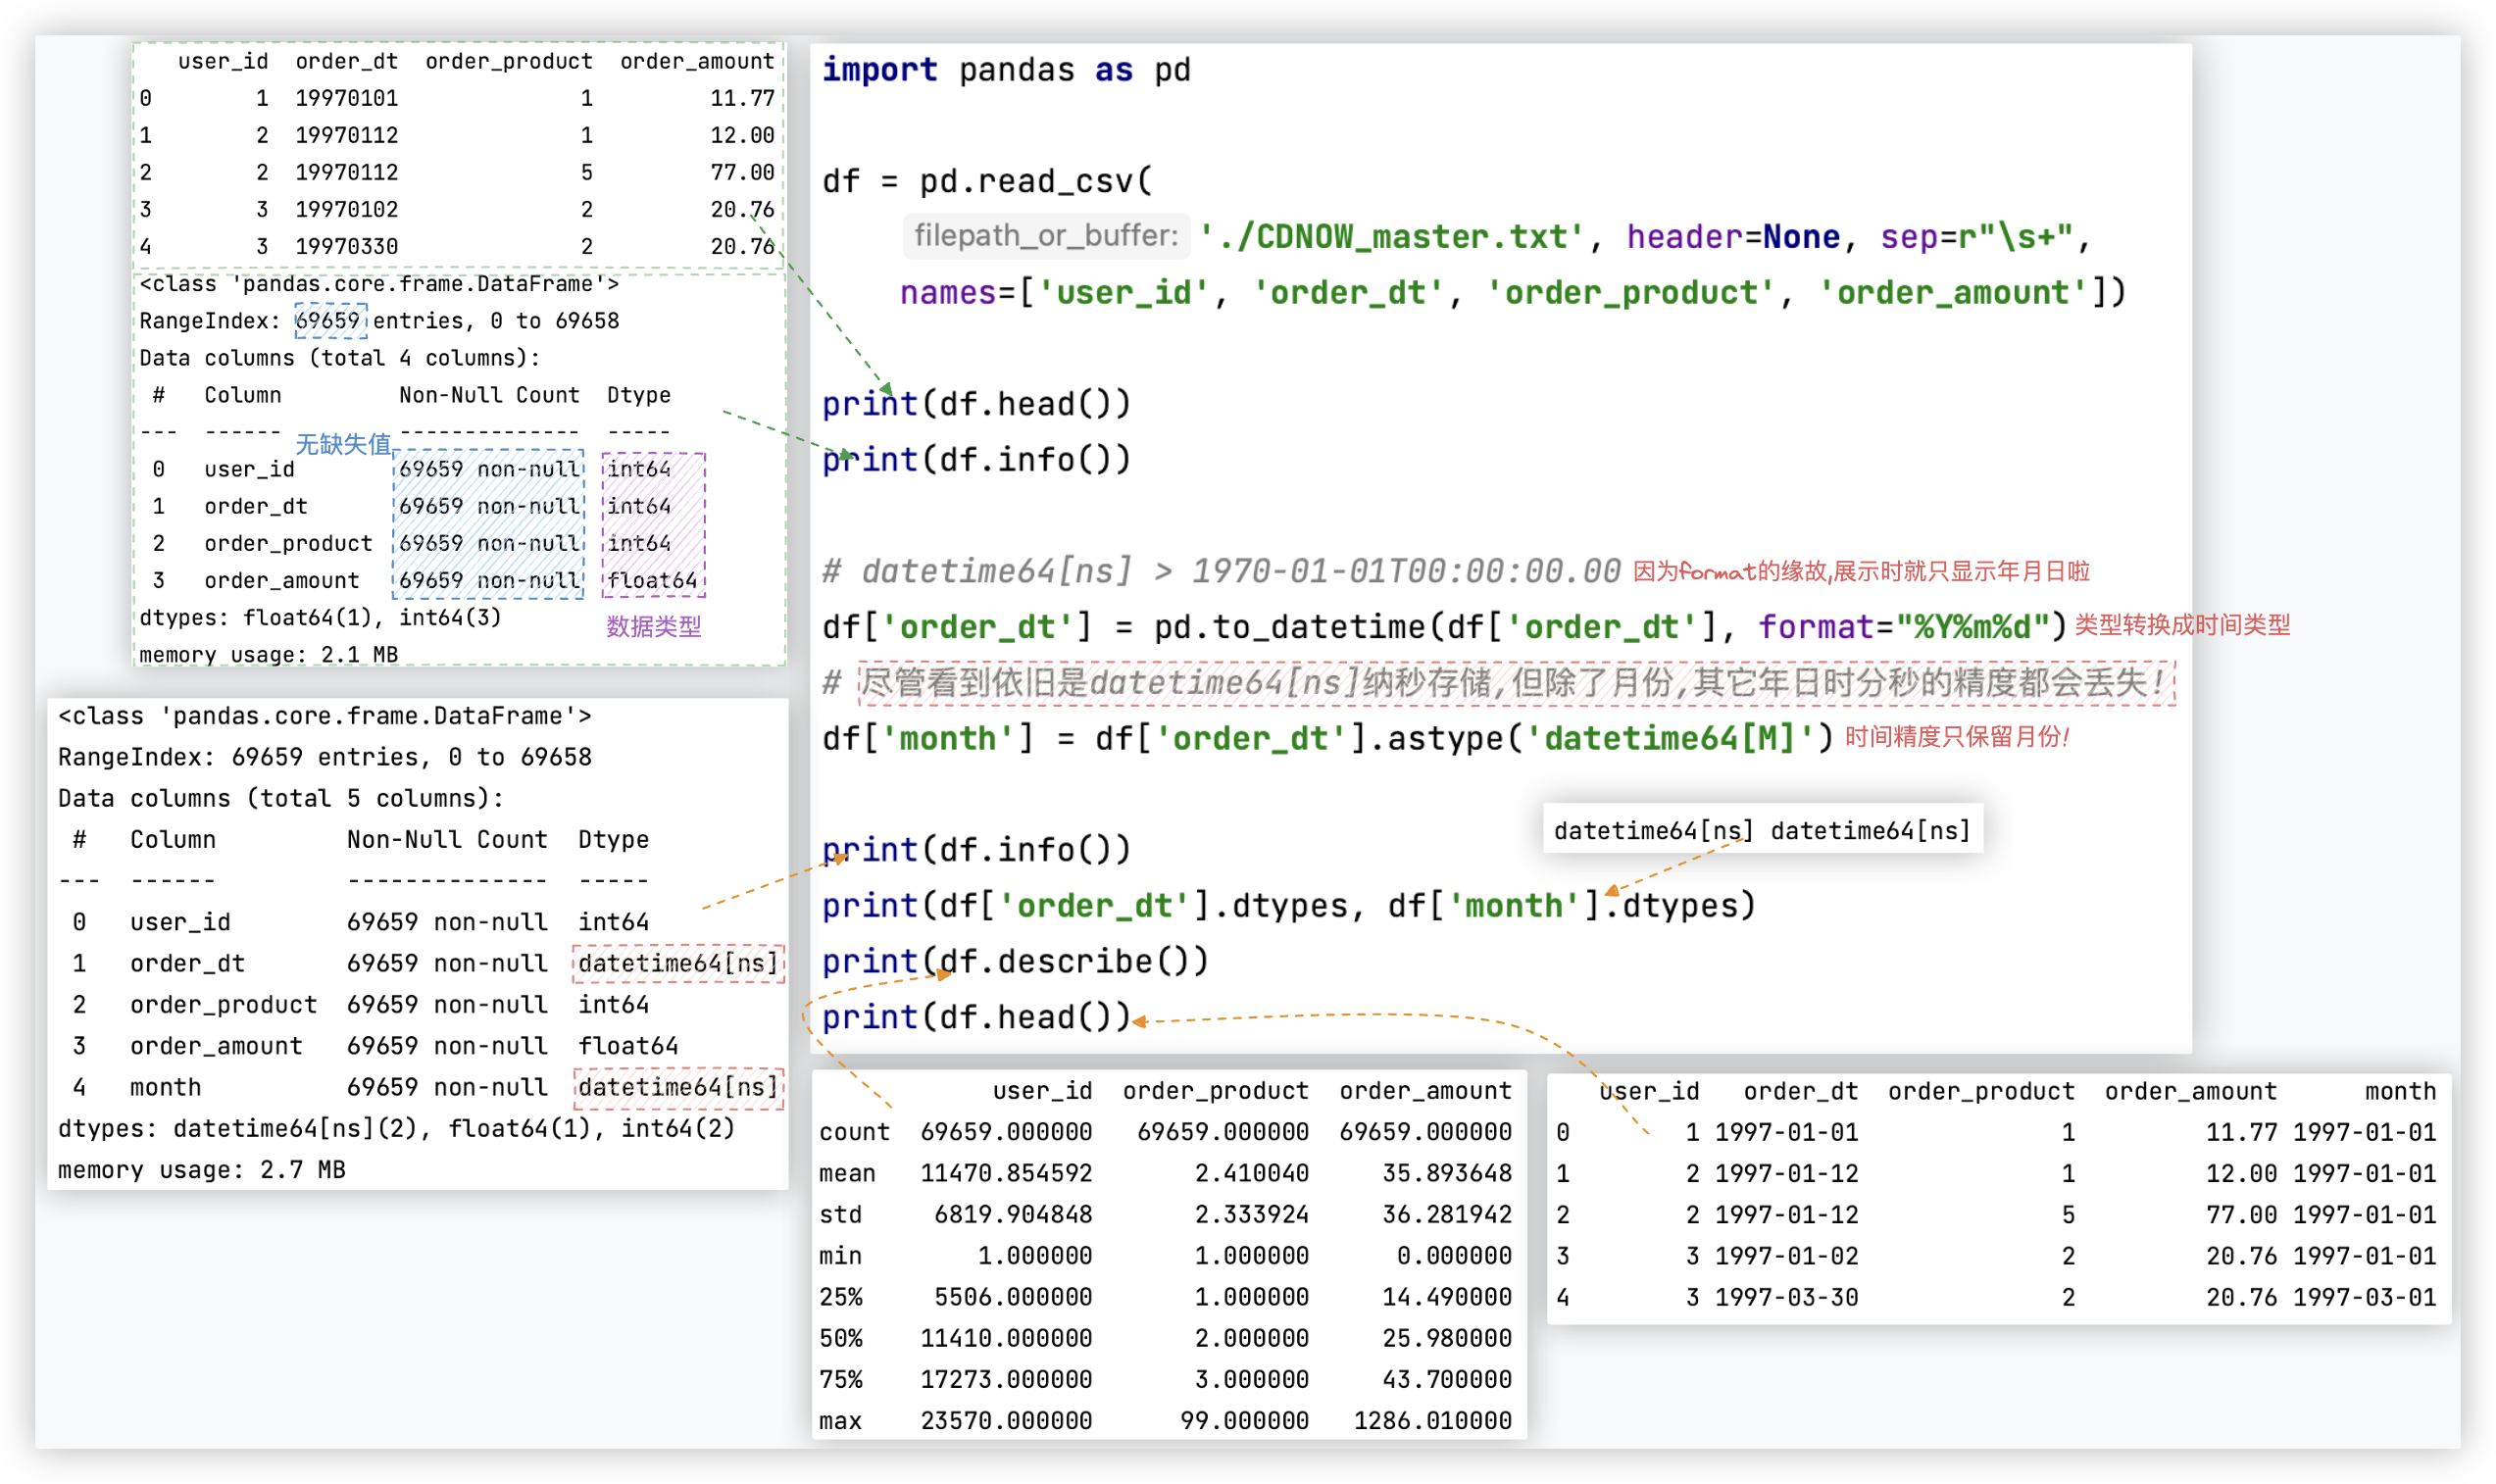
截图中的代码如下:
import pandas as pd

df = pd.read_csv(
    './CDNOW_master.txt', header=None, sep=r"\s+",
    names=['user_id', 'order_dt', 'order_product', 'order_amount'])

print(df.head())
print(df.info())

df['order_dt'] = pd.to_datetime(df['order_dt'], format="%Y%m%d")
df['month'] = df['order_dt'].astype('datetime64[M]')

print(df.info())
print(df['order_dt'].dtypes, df['month'].dtypes)
print(df.describe())
print(df.head())

"""
user_id          False
order_dt         False
order_product    False
order_amount     False
month            False
dtype: bool
"""
# 查看每一列是否含有空值!
print(df.isnull().any(axis=0))
2
3
4
5
6
7
8
9
10
11
12
13
14
15
16
17
18
19
20
21
22
23
24
25
26
27
# 第二部分: 按月进行分析
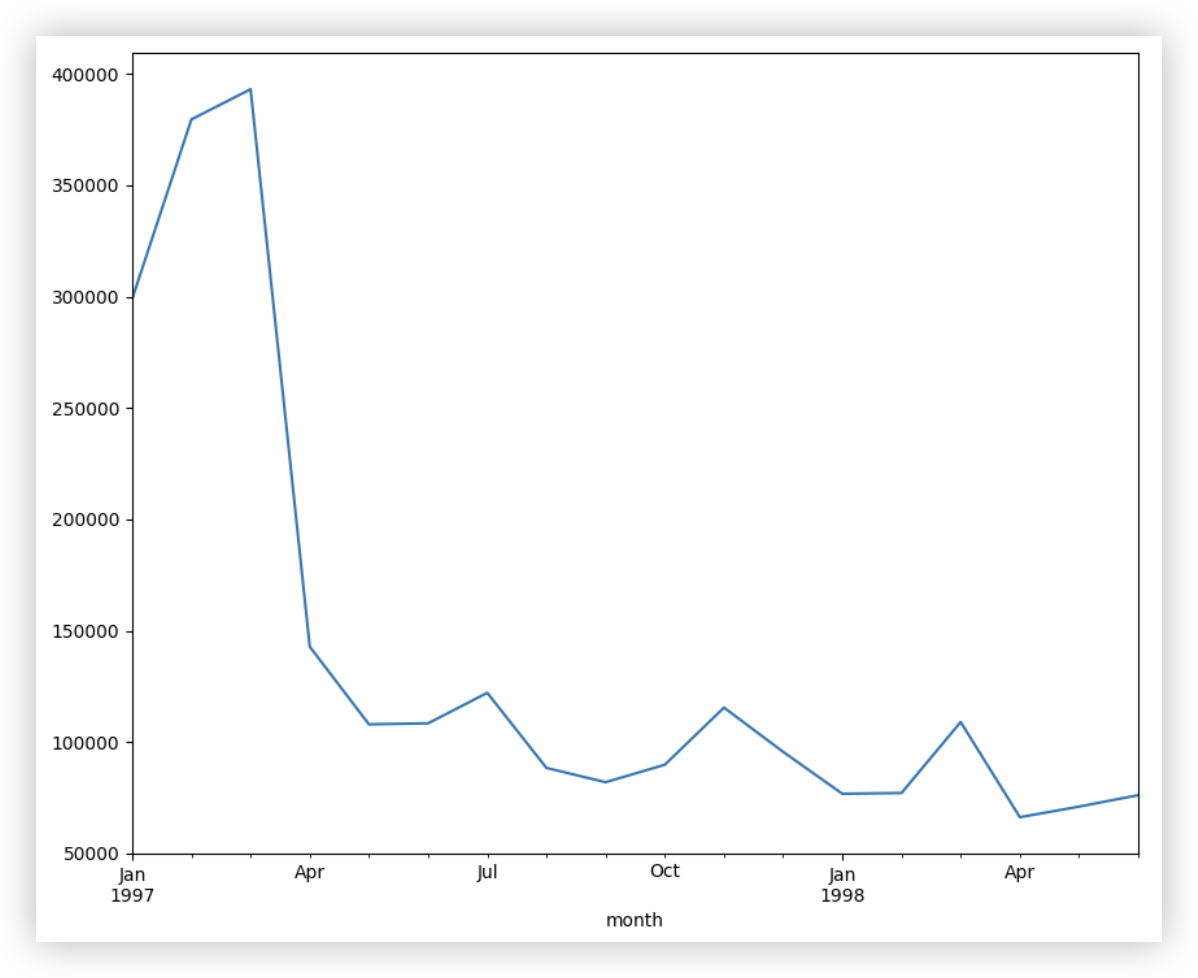
# Q1: 每个月的销售金额
   user_id   order_dt  order_product  order_amount      month
0        1 1997-01-01              1         11.77 1997-01-01
1        2 1997-01-12              1         12.00 1997-01-01
2        2 1997-01-12              5         77.00 1997-01-01
3        3 1997-01-02              2         20.76 1997-01-01
4        3 1997-03-30              2         20.76 1997-03-01
2
3
4
5
6
解决思路 - 按照月份进行分组后,对每一组里的销售金额order_amount进行相加.
"""
              user_id  order_product  order_amount
month
1997-01-01   35273171          19416     299060.17
1997-02-01  123068150          24921     379590.03
1997-03-01  194141841          26159     393155.27
"""
print(df.groupby('month').sum().head(3))
"""
month
1997-01-01    19416
1997-02-01    24921
1997-03-01    26159
Name: order_product, dtype: int64
"""
print(df.groupby('month')['order_amount'].sum().head(3))

amount_sum_series = df.groupby('month')['order_amount'].sum()
plt.figure(figsize=(10, 8))
# Series对象直接点plot进行画图时,x轴为索引、y轴为索引对应的具体值.
amount_sum_series.plot()
plt.show()
2
3
4
5
6
7
8
9
10
11
12
13
14
15
16
17
18
19
20
21
22
# Q2: 每个月的产品购买量
   user_id   order_dt  order_product  order_amount      month
0        1 1997-01-01              1         11.77 1997-01-01
1        2 1997-01-12              1         12.00 1997-01-01
2        2 1997-01-12              5         77.00 1997-01-01
3        3 1997-01-02              2         20.76 1997-01-01
4        3 1997-03-30              2         20.76 1997-03-01
2
3
4
5
6
解决思路 - 按照月份进行分组后,对每一组里的产品购买量order_product进行相加.
# 与Q1的实现同理
product_sum_series = df.groupby('month')['order_product'].sum()
2
# Q3: 每个月的消费次数
   user_id   order_dt  order_product  order_amount      month
0        1 1997-01-01              1         11.77 1997-01-01
1        2 1997-01-12              1         12.00 1997-01-01
2        2 1997-01-12              5         77.00 1997-01-01
3        3 1997-01-02              2         20.76 1997-01-01
4        3 1997-03-30              2         20.76 1997-03-01
2
3
4
5
6
解决思路 - 消费购买一次就是一条记录/一行数据. 那么按照月份进行分组后,看每一组的行数即可.
# - 方案1: size() 方法计算每个组的大小 (即每个组包含的行数).
series_1 = df.groupby('month').size()
# - 方案2: 按 'month' 列进行分组, 并统计每个组中 'user_id' 列的 [非空值] 数量
series_2 = df.groupby('month')['user_id'].count()
print(series_1.equals(series_2))  # True 表明这两个series对象长一样.
"""
month
1997-01-01     8928
1997-02-01    11272
1997-03-01    11598
1997-04-01     3781
1997-05-01     2895
dtype: int64
"""
print(series_1.head())
2
3
4
5
6
7
8
9
10
11
12
13
14
15
# Q4: 每个月的消费人数
   user_id   order_dt  order_product  order_amount      month
0        1 1997-01-01              1         11.77 1997-01-01
1        2 1997-01-12              1         12.00 1997-01-01
2        2 1997-01-12              5         77.00 1997-01-01
3        3 1997-01-02              2         20.76 1997-01-01
4        3 1997-03-30              2         20.76 1997-03-01
2
3
4
5
6
解决思路 - 同一个人当月消费多次只能算一个人. 而一条记录代表的是购买一次.
那么按照月份进行分组后,对每一组里user_id进行去重即可.
series_3 = df.groupby('month')['user_id'].nunique()
"""
month
1997-01-01    7846
1997-02-01    9633
1997-03-01    9524
1997-04-01    2822
1997-05-01    2214
Name: user_id, dtype: int64
"""
print(series_3.head())
2
3
4
5
6
7
8
9
10
11
# 第三部分: 用户个体消费分析
# Q1: 各个用户消费金额和消费产品数量的散点图
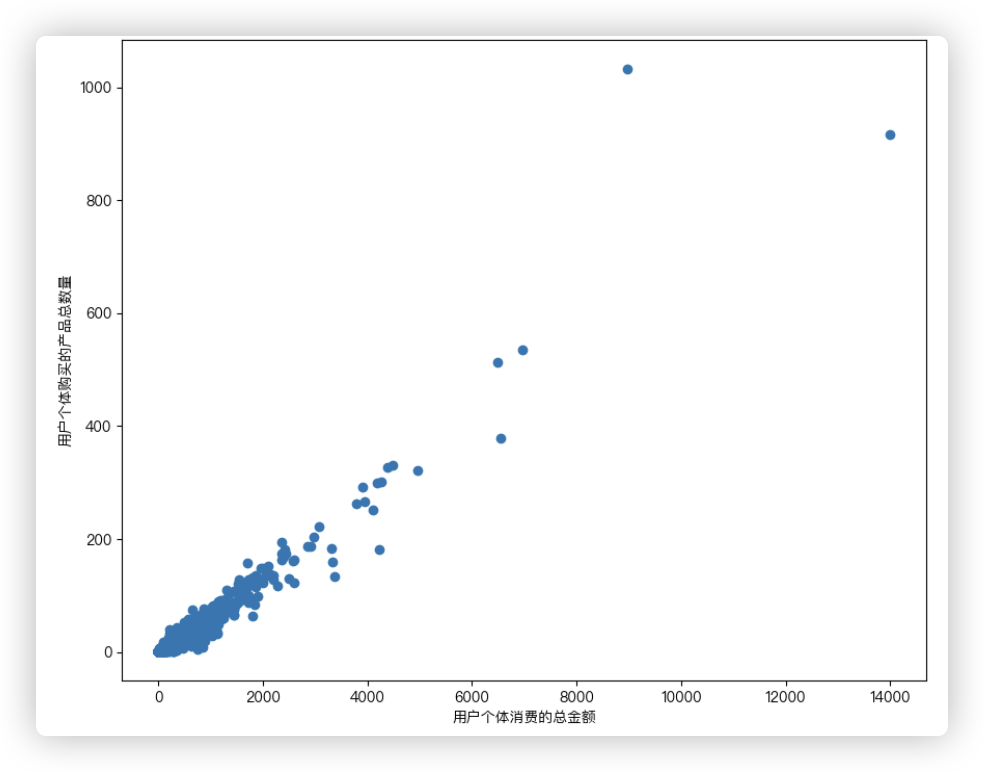
各个用户消费金额和消费产品数量的散点图
   user_id   order_dt  order_product  order_amount      month
0        1 1997-01-01              1         11.77 1997-01-01
1        2 1997-01-12              1         12.00 1997-01-01
2        2 1997-01-12              5         77.00 1997-01-01
3        3 1997-01-02              2         20.76 1997-01-01
4        3 1997-03-30              2         20.76 1997-03-01
2
3
4
5
6
解决思路 - 按照user_id用户个体进行分组后,对每一组里的购买金额order_amount进行相加.
就可以得到每个用户个体的消费金额, 它是放在一个series对象中的; 每个用户个体消费的产品数量同理.
两个series对象中的元素一一对应构成散点图中每个点的坐标!!
user_amount_series = df.groupby('user_id')['order_amount'].sum()
user_product_series = df.groupby('user_id')['order_product'].sum()
# 两组数据的索引是一样的,因为分组条件一样!!
plt.scatter(user_amount_series, user_product_series)
plt.xlabel("用户个体消费的总金额")
plt.ylabel("用户个体购买的产品总数量")
plt.show()
2
3
4
5
6
7
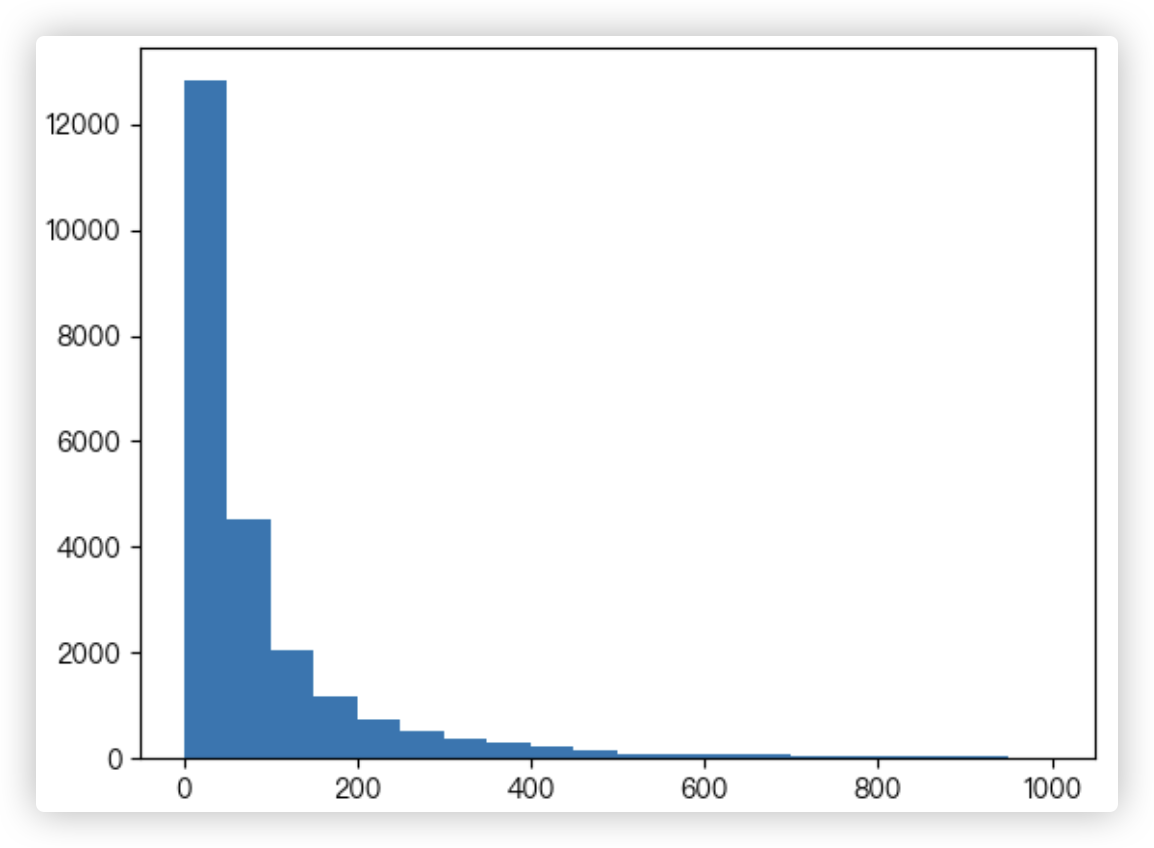
# Q2: 各个用户消费总金额(金额数<=1000)的直方分布图
   user_id   order_dt  order_product  order_amount      month
0        1 1997-01-01              1         11.77 1997-01-01
1        2 1997-01-12              1         12.00 1997-01-01
2        2 1997-01-12              5         77.00 1997-01-01
3        3 1997-01-02              2         20.76 1997-01-01
4        3 1997-03-30              2         20.76 1997-03-01
2
3
4
5
6
解决思路 - 按照user_id用户个体进行分组后,对每一组里的购买金额order_amount进行相加.
就可以得到每个用户个体的消费总金额. 然后筛选出总金额小于等于1000的. 接着画直方图, 可以重点分析 plt.hist() 返回的值.
user_amount_series = df.groupby('user_id')['order_amount'].sum()
user_amount_series = user_amount_series[user_amount_series <= 1000]
# 直方图每根柱子的宽对应x轴上的区间;高对应y轴,其值代表数量.
hist_info = plt.hist(user_amount_series, bins=20)
""" 每个箱子里放的东西的个数; 每个分区(分了20个箱子,那么这里就有21个数) ; 箱子对象
(array([12820.,  4508.,  2046.,  1188.,   747.,   513.,   374.,   290.,
         211.,   139.,    97.,    98.,    69.,    71.,    42.,    47.,
          33.,    29.,    27.,    21.]),
 array([  0.    ,  49.9845,  99.969 , 149.9535, 199.938 , 249.9225,
       299.907 , 349.8915, 399.876 , 449.8605, 499.845 , 549.8295,
       599.814 , 649.7985, 699.783 , 749.7675, 799.752 , 849.7365,
       899.721 , 949.7055, 999.69  ]),
 <BarContainer object of 20 artists>)
"""
print(hist_info)
plt.show()
2
3
4
5
6
7
8
9
10
11
12
13
14
15
16
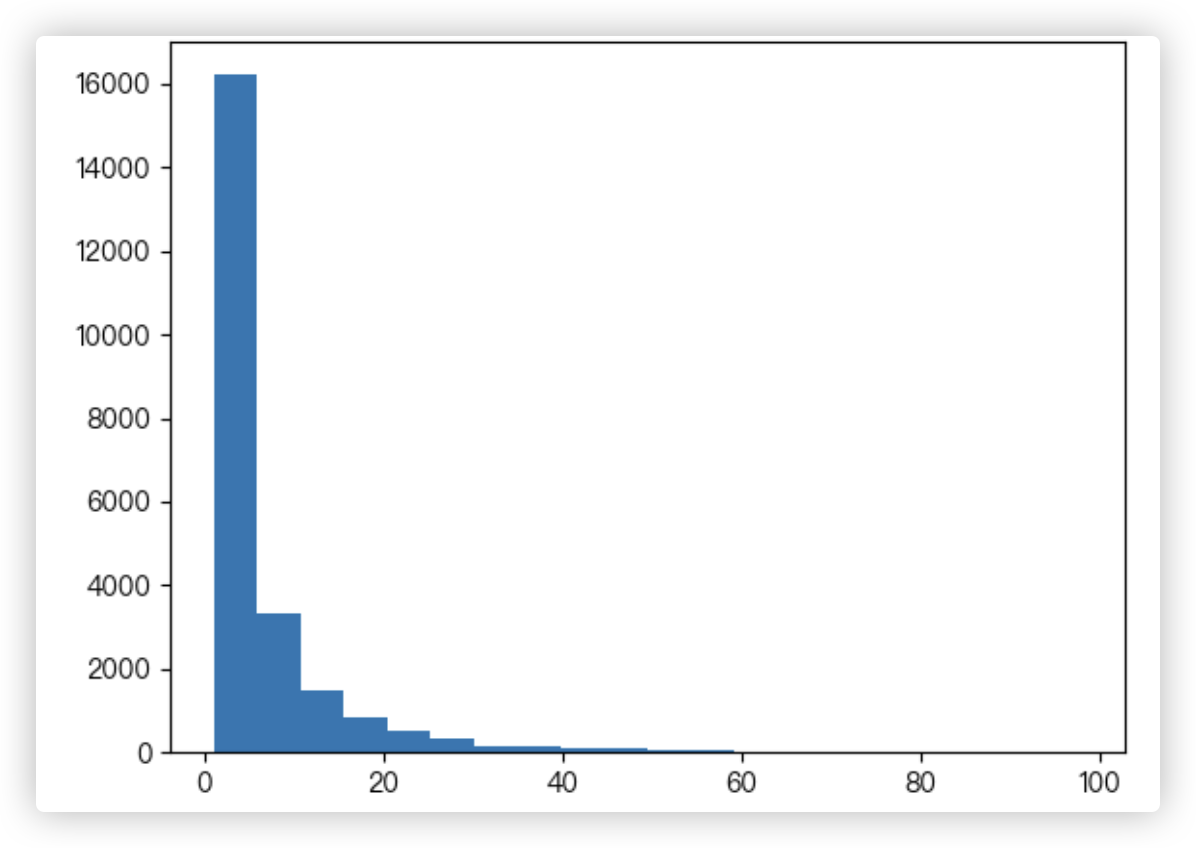
# Q3: 各个用户购买产品总数(购买数量<=100)的直方分布图
   user_id   order_dt  order_product  order_amount      month
0        1 1997-01-01              1         11.77 1997-01-01
1        2 1997-01-12              1         12.00 1997-01-01
2        2 1997-01-12              5         77.00 1997-01-01
3        3 1997-01-02              2         20.76 1997-01-01
4        3 1997-03-30              2         20.76 1997-03-01
2
3
4
5
6
解决思路 - 按照user_id用户个体进行分组后,对每一组里的购买产品数order_product进行相加.
就可以得到每个用户个体的购买产品的总数. 然后筛选出数量小于等于100的. 接着画直方图, 可以重点分析 plt.hist() 返回的值.
user_product_series = df.groupby('user_id')['order_product'].sum()
user_product_series = user_product_series[user_product_series <= 100]
hist_info = plt.hist(user_product_series, bins=20)
"""
(array([1.6212e+04, 3.3310e+03, 1.5040e+03, 8.2600e+02, 4.9600e+02,
       3.3400e+02, 1.6100e+02, 1.6700e+02, 9.7000e+01, 8.8000e+01,
       6.1000e+01, 5.5000e+01, 3.1000e+01, 2.6000e+01, 2.0000e+01,
       2.2000e+01, 2.4000e+01, 1.5000e+01, 1.3000e+01, 8.0000e+00]),
 array([ 1.  ,  5.85, 10.7 , 15.55, 20.4 , 25.25, 30.1 , 34.95, 39.8 ,
       44.65, 49.5 , 54.35, 59.2 , 64.05, 68.9 , 73.75, 78.6 , 83.45,
       88.3 , 93.15, 98.  ]),
 <BarContainer object of 20 artists>)
"""
print(hist_info)
plt.show()
2
3
4
5
6
7
8
9
10
11
12
13
14
15
# 第四部分: 用户消费行为分析
# Q1: 每月新增用户数
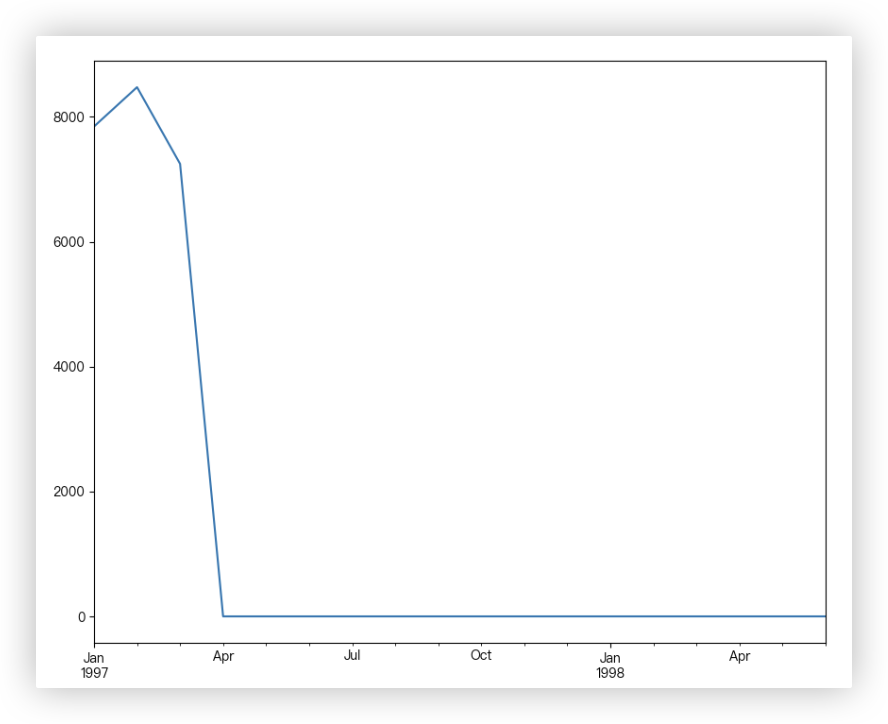
每月新增用户数,换个说法: 用户第一次消费的月份分布和人数统计
   user_id   order_dt  order_product  order_amount      month
0        1 1997-01-01              1         11.77 1997-01-01
1        2 1997-01-12              1         12.00 1997-01-01
2        2 1997-01-12              5         77.00 1997-01-01
3        3 1997-01-02              2         20.76 1997-01-01
4        3 1997-03-30              2         20.76 1997-03-01
2
3
4
5
6
解决思路:
○ Step1: df.groupby('user_id')['month'].min()
按照user_id分组后,粒度到了每个用户个体,看每组内mouth列中的最小值, 因此可以得到每个用户第一次购物所在的月份;
○ Step2: 第一步得到的是一个series对象, series对象.value_counts().sort_index()
统计元素出现的次数并根据索引进行排序; 因此我们可以得到每个月新增的用户数. (索引不完整,不是我们想要的
○ Step3: 构建一个新的Series对象用于画折线图.
其索引是 月份列去重后并重新排序后的索引 sorted(df['month'].unique())
其值是 第二步得到的series对象,将其转换为字典, 字典的key与画图的series对象的索引进行对应,没对应上的,值为Nan.
将画图的series对象的Nan值填充为0.
○ Step4: 利用 Serise对象.plot() 快捷的画出折线图!
temp1 = df.groupby('user_id')['month'].min()
"""
user_id
1       1997-01-01
2       1997-01-01
3       1997-01-01
4       1997-01-01
5       1997-01-01
           ...
23566   1997-03-01
23567   1997-03-01
23568   1997-03-01
23569   1997-03-01
23570   1997-03-01
Name: month, Length: 23570, dtype: datetime64[ns]
"""
print(temp1)

"""
1997-02-01    8476
1997-01-01    7846
1997-03-01    7248
Name: month, dtype: int64
"""
temp2 = temp1.value_counts()  # series对象.value_counts() 汇总每个元素出现的次数
"""
1997-02-01    8476
1997-01-01    7846
1997-03-01    7248
Name: month, dtype: int64
"""
print(temp2)

temp2.sort_index(inplace=True)  # series对象.sort_index() 返回一个按索引升序排列的新Series
"""
1997-01-01    7846
1997-02-01    8476
1997-03-01    7248
Name: month, dtype: int64
"""
print(temp2)

# - 构建一个新的series对象用于画图
"""
{ Timestamp('1997-01-01 00:00:00'): 7846,
  Timestamp('1997-02-01 00:00:00'): 8476,
  Timestamp('1997-03-01 00:00:00'): 7248 }
"""
print(temp2.to_dict())  # 新series对象的值
"""
[numpy.datetime64('1997-01-01T00:00:00.000000000'),
 numpy.datetime64('1997-02-01T00:00:00.000000000'),
 numpy.datetime64('1997-03-01T00:00:00.000000000'),
 numpy.datetime64('1997-04-01T00:00:00.000000000'),
 numpy.datetime64('1997-05-01T00:00:00.000000000')]
"""
print(sorted(df['month'].unique())[:5])  # 新series对象的索引
my_s = pd.Series(index=sorted(df['month'].unique()), data=temp2.to_dict())
"""
1997-01-01    7846.0
1997-02-01    8476.0
1997-03-01    7248.0
1997-04-01       NaN
1997-05-01       NaN
dtype: float64
"""
print(my_s.head())
my_s = my_s.fillna(0)  # 将Series对象中的Nan值填充为0
"""
1997-01-01    7846.0
1997-02-01    8476.0
1997-03-01    7248.0
1997-04-01       0.0
1997-05-01       0.0
dtype: float64
"""
print(my_s.head())
my_s.plot()
plt.show()
2
3
4
5
6
7
8
9
10
11
12
13
14
15
16
17
18
19
20
21
22
23
24
25
26
27
28
29
30
31
32
33
34
35
36
37
38
39
40
41
42
43
44
45
46
47
48
49
50
51
52
53
54
55
56
57
58
59
60
61
62
63
64
65
66
67
68
69
70
71
72
73
74
75
76
77
78
79
# Q2: 每月流失用户数
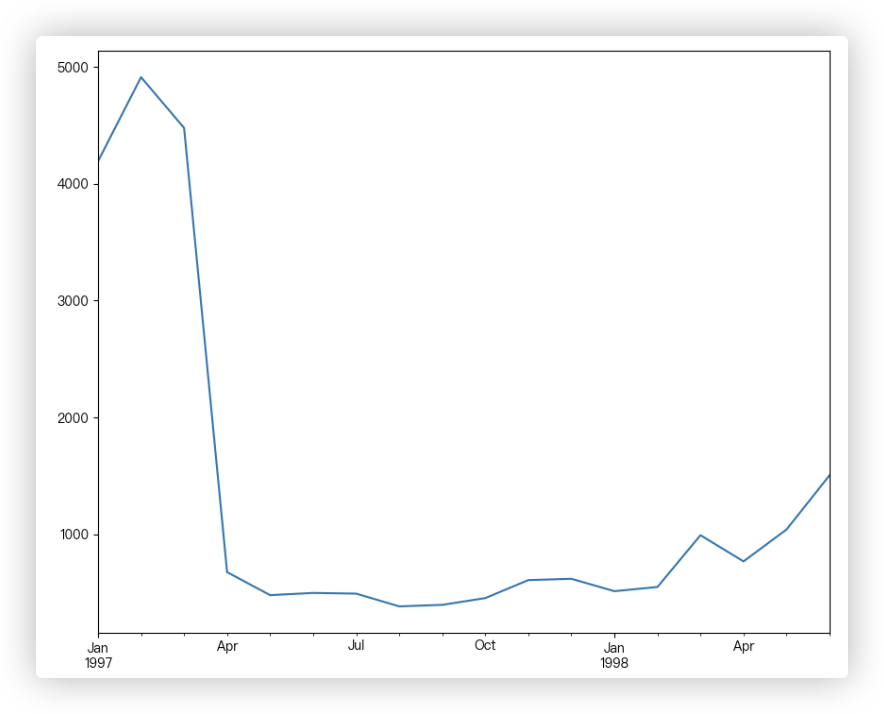
每月流失用户数, 换个说法: 用户最后一次消费的月份分布和人数统计.
   user_id   order_dt  order_product  order_amount      month
0        1 1997-01-01              1         11.77 1997-01-01
1        2 1997-01-12              1         12.00 1997-01-01
2        2 1997-01-12              5         77.00 1997-01-01
3        3 1997-01-02              2         20.76 1997-01-01
4        3 1997-03-30              2         20.76 1997-03-01
2
3
4
5
6
解决思路:
大体思路跟每月新增用户数的思路是一样的, 不再赘述.. 在代码上的体现也就是min()变成了max(). 另外注意两点理解:
-1- eg: 用户A在97年1月份购物后,往后时间都没有在该场所购物, 那么就可以说 在97年1月份流失了该用户.
-2- 得到每个月流失用户数的Series数据后, 你观察它的索引, 刚好是我们画图所要的那些月份, 因此可以直接拿来画图!
temp = df.groupby('user_id')['month'].max().value_counts().sort_index()
temp.plot()
plt.show()
2
3
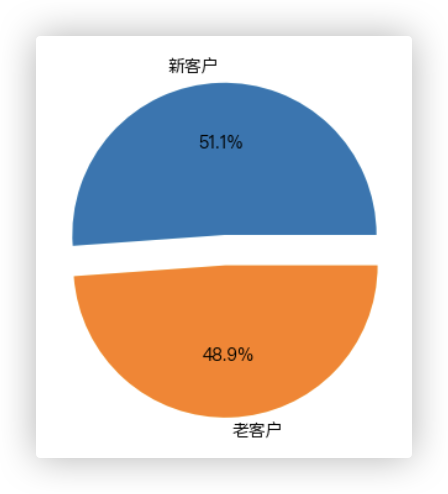
# Q3: 新老用户占比
   user_id   order_dt  order_product  order_amount      month
0        1 1997-01-01              1         11.77 1997-01-01
1        2 1997-01-12              1         12.00 1997-01-01
2        2 1997-01-12              5         77.00 1997-01-01
3        3 1997-01-02              2         20.76 1997-01-01
4        3 1997-03-30              2         20.76 1997-03-01
2
3
4
5
6
解决思路:
先明确一个定义, 何为新用户, 何为老用户?
老用户是指在多个日期进行了消费, 评判标准不是消费次数哦, 在同一天消费多次, 是不算老用户的.
那么, 我们根据user_id对用户个体进行分组, 再对每个分组的order_dt列 进行min、max两种聚合运算.
借此我们可以得到每个用户个体第一次购买的日期和最后一次购买的日期.
若两个日期一样, 则该用户个体是新用户, 否则是老用户.. (不一样就相当于至少在两个日期购买了商品呗..Hhh
df_new_old = df.groupby(by='user_id')['order_dt'].agg(['min', 'max'])
"""
               min        max
user_id
1       1997-01-01 1997-01-01
2       1997-01-12 1997-01-12
3       1997-01-02 1998-05-28
4       1997-01-01 1997-12-12
5       1997-01-01 1998-01-03
"""
print(df_new_old.head())
new_old_counts_series = (df_new_old['min'] == df_new_old['max']).value_counts()
"""
True     12054
False    11516
dtype: int64
"""
print(new_old_counts_series)
plt.pie(x=new_old_counts_series, autopct='%.1f%%', labels=["新客户", "老客户"], explode=[0, 0.1])
plt.show()
2
3
4
5
6
7
8
9
10
11
12
13
14
15
16
17
18
19
20
补充, 还有个解决方案:
s1 = df.groupby('user_id')['order_dt'].agg(['max','min'])
(s1['max'] == s1['min']).value_counts()

s2 = df.groupby('user_id')['order_dt'].nunique()
(s2>1).value_counts()

"""
前面转换成时间类型时,里面的format是将时间类型的格式控制到年月日??还是 将精度控制到年月日..
我们去掉format参数 发现时间类型数据长这样 1970-01-01 00:00:00.0  其时分秒毫秒都是0.. So,format控制的是格式!!
"""
2
3
4
5
6
7
8
9
10
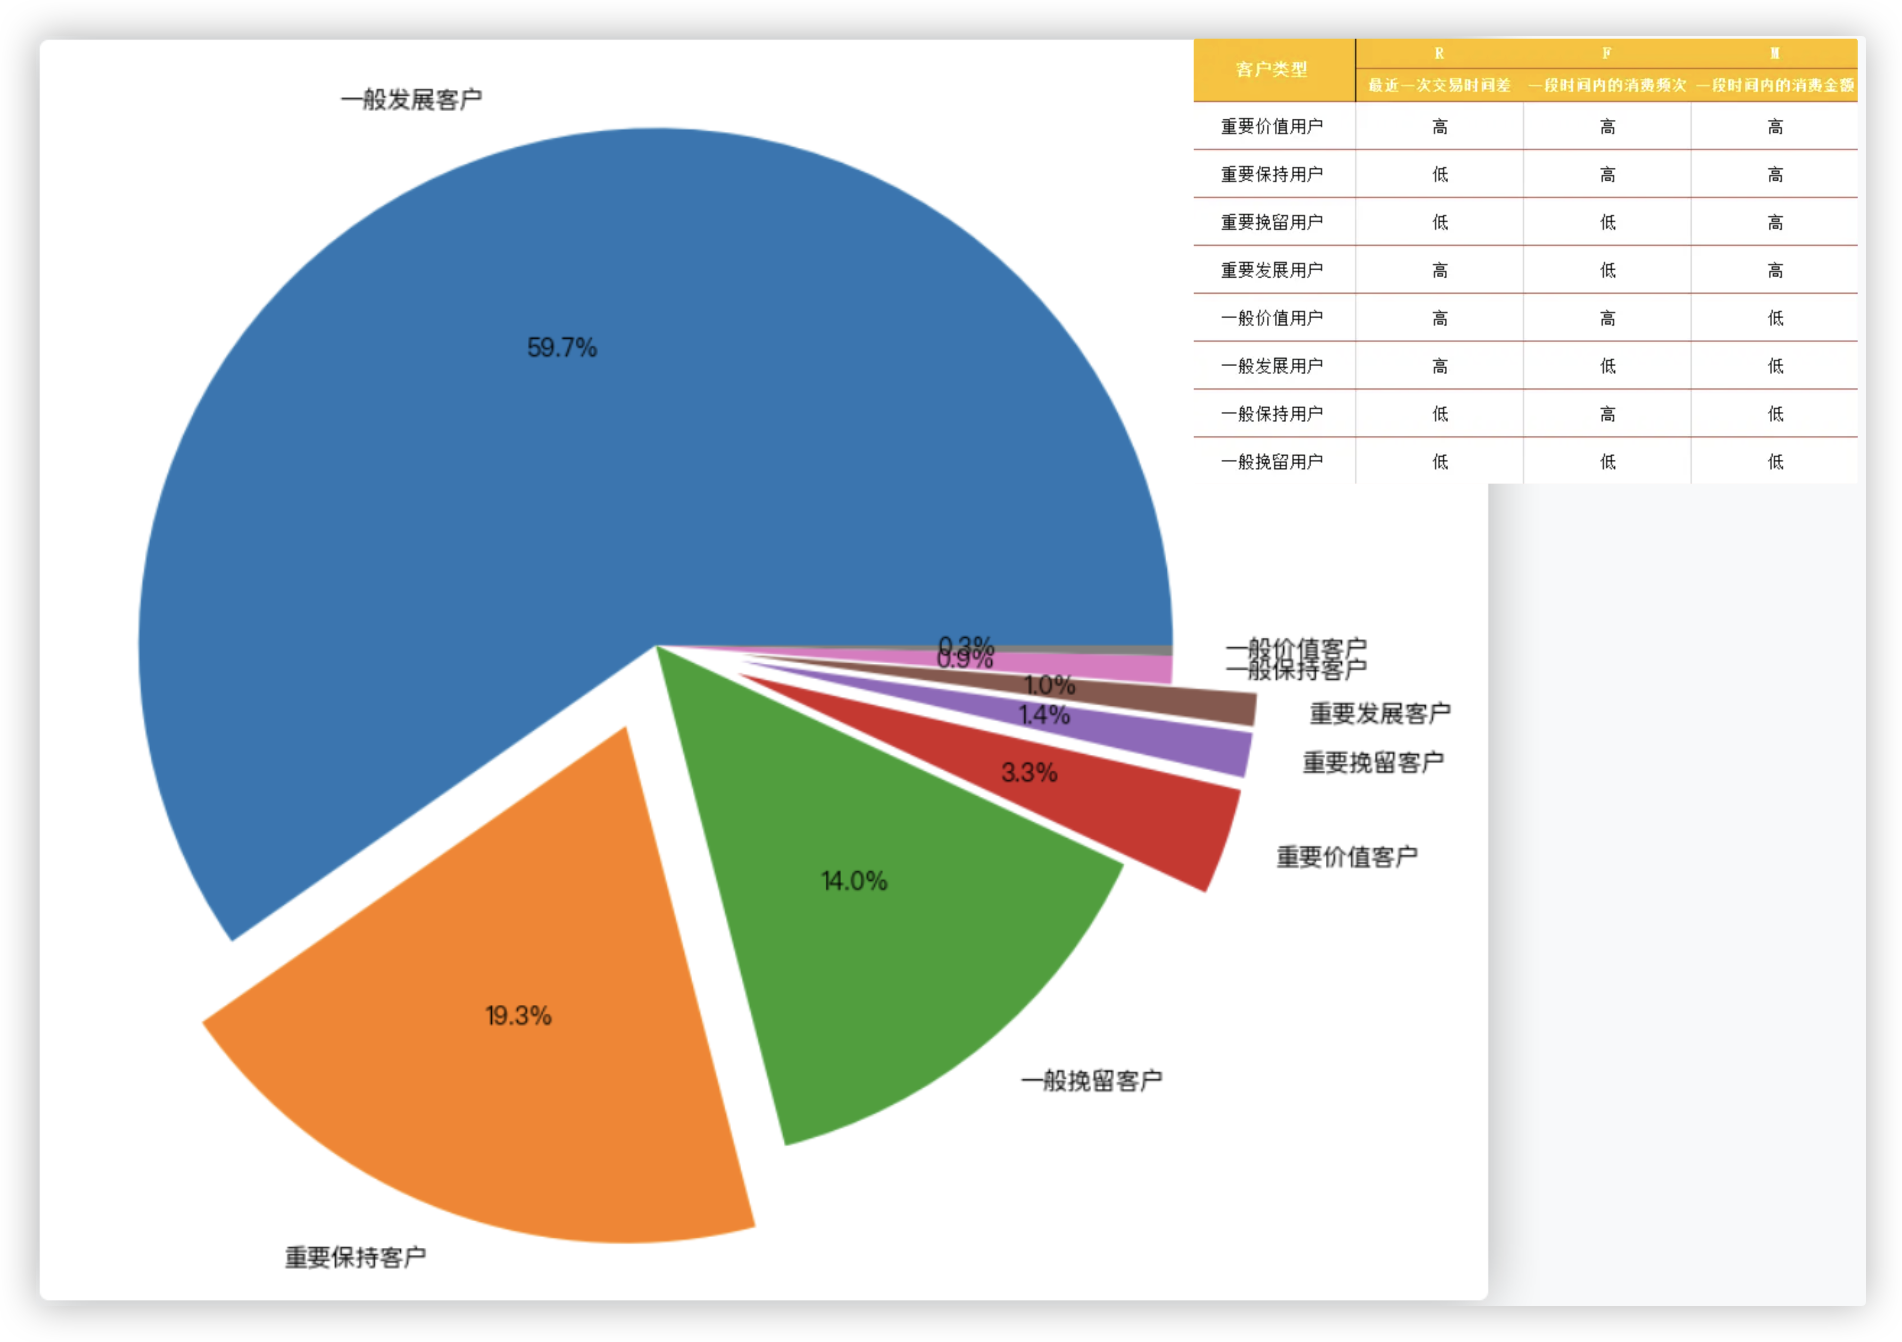
# Q4: RFM模型设计
   user_id   order_dt  order_product  order_amount      month
0        1 1997-01-01              1         11.77 1997-01-01
1        2 1997-01-12              1         12.00 1997-01-01
2        2 1997-01-12              5         77.00 1997-01-01
3        3 1997-01-02              2         20.76 1997-01-01
4        3 1997-03-30              2         20.76 1997-03-01
2
3
4
5
6
F表示客户购买商品的总数量; M表示客户交易的金额; R表示客户最近一次交易时间到现在的时间间隔.
(计算R时, 现在的时间我们采用 已知的最大的交易时间/最新订单日期
解决思路:
○ Step1: 得到一个与RFM相关的表格数据.
该表格中包含每个用户的总购买量和总消费金额and最近一次消费的时间
技术要点 - 根据user_id对用户个体进行分组, 再通过agg实现对分组后的每个组里的不同列进行不同形式的聚合操作.
○ Step2: 计算R, 并添加到第一步得到的表格中.
R = 最新订单日期 - 每个用户最近一次消费的时间 结果是一个series对象.
○ Step3: rfm分层算法. R越小, F越大表示客户交易越频繁, M越大表示客户价值越高 - 越好.
# 对每个分组里的不同列进行任意的聚合
temp = df.groupby(by='user_id').agg({'order_product': 'sum', 'order_amount': 'sum', 'order_dt': 'max'})
"""
         order_product  order_amount   order_dt
user_id
1                    1         11.77 1997-01-01
2                    6         89.00 1997-01-12
3                   16        156.46 1998-05-28
4                    7        100.50 1997-12-12
5                   29        385.61 1998-01-03
"""
print(temp.head())
# `/ np.timedelta64(1, 'D')` 表示1天,通过除以这个值,我们将时间差转换为天数
temp['R'] = (df["order_dt"].max() - temp["order_dt"]) / np.timedelta64(1, 'D')
rfm = temp[["R", "order_product", "order_amount"]]
# rfm = rfm.rename(columns={"order_product": "F", "order_amount": "M"}) 这样改列索引也可以.
rfm.columns = ['R', 'F', 'M']
"""
             R   F       M
user_id
1        545.0   1   11.77
2        534.0   6   89.00
3         33.0  16  156.46
4        200.0   7  100.50
5        178.0  29  385.61
"""
print(rfm.head())

# rfm分层算法

temp = rfm.apply(lambda x: x - x.mean(), axis=0)
"""
                  R          F           M
user_id
1        177.778362  -6.122656  -94.310426
2        166.778362  -1.122656  -17.080426
3       -334.221638   8.877344   50.379574
4       -167.221638  -0.122656   -5.580426
5       -189.221638  21.877344  279.529574
"""
print(temp.head())

def rfm_func(x):
    # 对 一行/一个series对象 进行处理
    level = x.map(lambda i: '1' if i > 0 else '0')  # 将 一行/series 中的元素都转换成了"0""1"的字符串
    label = level.sum()  # eg:"011"
    d = {
        '111': '重要价值客户',
        '011': '重要保持客户',
        '001': '重要挽留客户',
        '101': '重要发展客户',
        '110': '一般价值客户',
        '100': '一般发展客户',
        '010': '一般保持客户',
        '000': '一般挽留客户'
    }
    return d[label]

rfm['label'] = temp.apply(rfm_func, axis=1)  # 不断的将每一行数据给rfm_func函数
"""
             R   F       M   label
user_id
1        545.0   1   11.77  一般发展客户
2        534.0   6   89.00  一般发展客户
3         33.0  16  156.46  重要保持客户
4        200.0   7  100.50  一般挽留客户
5        178.0  29  385.61  重要保持客户
"""
print(rfm.head())
rfm_pic = rfm['label'].value_counts()
# 画饼图
plt.pie(
    x=rfm_pic, autopct='%.1f%%', labels=rfm_pic.index, radius=1.2,
    explode=[0, 0.2, 0, 0.2, 0.2, 0.2, 0, 0])
plt.show()
2
3
4
5
6
7
8
9
10
11
12
13
14
15
16
17
18
19
20
21
22
23
24
25
26
27
28
29
30
31
32
33
34
35
36
37
38
39
40
41
42
43
44
45
46
47
48
49
50
51
52
53
54
55
56
57
58
59
60
61
62
63
64
65
66
67
68
69
70
71
72
73
74
75
# 第五部分: 用户的生命周期
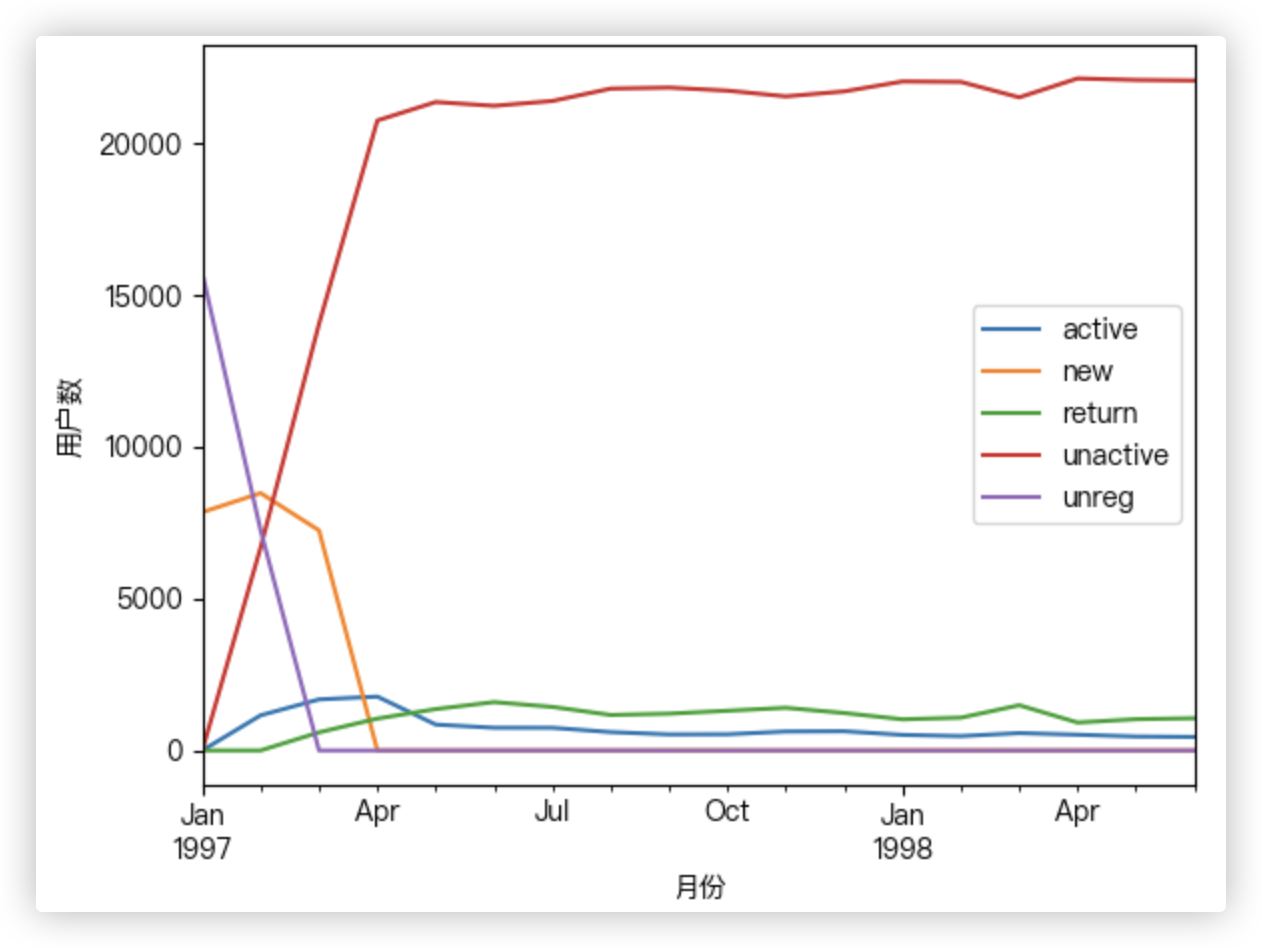
将用户按照每一个月份分成:
-1- unreg: 观望用户(前两月没买, 第三个月才第一次买, 则用户前两个月为观望用户).
-2- unactive: 首月购买后, 后序月份没有购买则在没有购买的月份中该用户的为非活跃用户.
-3- new: 当前月就进行首次购买的用户在当前月为新用户.
-4- active: 连续月份购买的用户在这些月中为活跃用户.
-5- return: 购买之后间隔n月再次购买的第一个月份为该月份的回头客.
   user_id   order_dt  order_product  order_amount      month
0        1 1997-01-01              1         11.77 1997-01-01
1        2 1997-01-12              1         12.00 1997-01-01
2        2 1997-01-12              5         77.00 1997-01-01
3        3 1997-01-02              2         20.76 1997-01-01
4        3 1997-03-30              2         20.76 1997-03-01
2
3
4
5
6
解决思路:
○ Step1: 统计每个用户每个月的消费次数.
○ Step2: 对第一步得到的df数据进行处理, 统计每个用户每个月是否消费, 若消费记录为1否则记录为0.
○ Step3: 用固定算法 判断用户在某个月份的用户类型 (新、活跃、不活跃、回流用户.
○ Step4: 对每月[不同活跃] 用户的进行计数
# 统计每个用户每个月的消费次数
df_purchase = df.pivot_table(index='user_id', values='order_dt', aggfunc='count', columns='month', fill_value=0)
"""
month    1997-01-01  1997-02-01  1997-03-01  ...  1998-04-01  1998-05-01  1998-06-01
user_id                                      ...
1                 1           0           0  ...           0           0           0
2                 2           0           0  ...           0           0           0
3                 1           0           1  ...           0           1           0
4                 2           0           0  ...           0           0           0
5                 2           1           0  ...           0           0           0
"""
print(df_purchase.head())
df_purchase = df_purchase.applymap(lambda x: 1 if x > 0 else 0)
"""
month    1997-01-01  1997-02-01  1997-03-01  ...  1998-04-01  1998-05-01  1998-06-01
user_id                                      ...
1                 1           0           0  ...           0           0           0
2                 1           0           0  ...           0           0           0
3                 1           0           1  ...           0           1           0
4                 1           0           0  ...           0           0           0
5                 1           1           0  ...           0           0           0
"""
print(df_purchase.head())


# 固定算法 判断是否为 新、活跃、不活跃、回流用户
def active_status(data):  # data整行数据 共12列 即一个用户的12个月的消费记录
    status = []  # 负责存储用户 12 个月的状态:unreg|new|active|unactive|return
    for i in range(len(data)):
        # 本月没有消费
        if data[i] == 0:
            if len(status) == 0:  # 前面没有任何记录(21年1月份)
                status.append('unreg')
            else:  # 开始判断上一个月状态
                if status[i - 1] == 'unreg':  # 一直未消费过
                    status.append('unreg')
                else:  # 只要本月没有消费当前的为0且不是unreg 只能为unactive
                    status.append('unactive')
        # 本月有消费==1
        else:
            if len(status) == 0:  # 前面没有任何记录(21年1月份)
                status.append('new')
            else:  # 之前有过记录  开始判断上一个月状态
                if status[i - 1] == 'unactive':  # 上个月没有消费
                    status.append('return')
                elif status[i - 1] == 'unreg':  # 以前没有消费过
                    status.append('new')
                else:
                    status.append('active')
    return status


pivoted_status = df_purchase.apply(active_status, axis=1)
"""
user_id
1    [new, unactive, unactive, unactive, unactive, ...
2    [new, unactive, unactive, unactive, unactive, ...
3    [new, unactive, return, active, unactive, unac...
4    [new, unactive, unactive, unactive, unactive, ...
5    [new, active, unactive, return, active, active...
dtype: object
"""
print(pivoted_status.head())

df_purchase_new = pd.DataFrame(
    data=pivoted_status.tolist(), index=df_purchase.index, columns=df_purchase.columns)
"""
month   1997-01-01 1997-02-01 1997-03-01  ... 1998-04-01 1998-05-01 1998-06-01
user_id                                   ...
1              new   unactive   unactive  ...   unactive   unactive   unactive
2              new   unactive   unactive  ...   unactive   unactive   unactive
3              new   unactive     return  ...   unactive     return   unactive
4              new   unactive   unactive  ...   unactive   unactive   unactive
5              new     active   unactive  ...   unactive   unactive   unactive
"""
print(df_purchase_new.head())

# 每月【不同活跃】用户的计数
# df_purchase_new.apply(lambda x: x.value_counts(), axis=0).T.fillna(0) 一样的!!
stats_res = df_purchase_new.apply(lambda x: pd.value_counts(x), axis=0).fillna(0).T
"""
            active     new  return  unactive    unreg
month
1997-01-01     0.0  7846.0     0.0       0.0  15724.0
1997-02-01  1157.0  8476.0     0.0    6689.0   7248.0
1997-03-01  1681.0  7248.0   595.0   14046.0      0.0
1997-04-01  1773.0     0.0  1049.0   20748.0      0.0
1997-05-01   852.0     0.0  1362.0   21356.0      0.0
"""
print(stats_res.head())

stats_res.plot()
plt.xlabel("月份")
plt.ylabel("用户数")
plt.show()
2
3
4
5
6
7
8
9
10
11
12
13
14
15
16
17
18
19
20
21
22
23
24
25
26
27
28
29
30
31
32
33
34
35
36
37
38
39
40
41
42
43
44
45
46
47
48
49
50
51
52
53
54
55
56
57
58
59
60
61
62
63
64
65
66
67
68
69
70
71
72
73
74
75
76
77
78
79
80
81
82
83
84
85
86
87
88
89
90
91
92
93
94
95
